
A Study of High Frequency Cryptocurrency Rebalancing

Over the course of the last year and a half, our team has become recognized as a global leader for portfolio rebalancing in the crypto market. Executing over $350M in rebalances, Shrimpy has captured the minds of tens of thousands of cryptocurrency traders. Not only did we introduce rebalancing as a viable option for the average crypto user, our research has lead to the exploration of a new strategy — high frequency rebalancing.
If you’re new to rebalancing, sign up for a Shrimpy account and join our Telegram group to stay up to date on the latest research. We also recommend reading one of the first articles we ever published here:
Portfolio Rebalancing for Cryptocurrency
Our team has analyzed the performance of hundreds of thousands of different portfolios over the course of the last year. We’ve found the rebalance period which historically performed the best was somewhere between 1 hour and 1 day. This study will investigate these intraday rebalance periods to determine how rebalances between 1 hour and 1 day has historically performed. The goal is to better characterize high frequency rebalances.
Rebalance vs. HODL: A Technical Analysis
Before we dig into the results, it’s important to understand how the study was set up. The source of our data, backtest restrictions, and configurations all impact the results we obtain. Without this information, it’s difficult to discern how we reached our conclusions. If you can’t wait to get to the results, feel free to skip ahead to the “Results” section.
Trades & Data
A complete year of exact bid-ask market data was collected from the Binance exchange for each asset pair they support. Beginning on May 3, 2018 and ended on May 3, 2019, this precise data was used to evaluate the specific trades at the moment a rebalance would have been performed.
When trades were simulated for this study, a standard fee of .075% was factored into the calculations. This is currently the highest trading fee for Binance users who have enabled the ability to use BNB for fees. Since this is the most common scenario for users on the Shrimpy application, we will use this as our base fee rate. During each backtest, this fee will be taken on every trade. So, a trade from LTC to XMR would trade from LTC to BTC and then BTC to XMR. In this instance, both trades incurred a .075% fee. The result is an accurate model of how fees will be taken in a live trading scenario.
As mentioned, our backtests use actual bid-ask data collected from the exchange. This data provides a precision that is not available with other data sources such as CoinMarketCap. The results are close simulations to what actually takes place during a portfolio rebalance.
Finally, our studies don’t attempt to apply analysis of traditional markets to cryptocurrencies. These two markets are different in many ways, which means we can’t always apply traditional market research to the crypto space. Attempting to do so can result in inaccurate conclusions.
Caution: People have recently been publishing studies which evaluate the performance of trading strategies by using CoinMarketCap data. CoinMarketCap does not provide bid-ask data, but aggregated data which should not be used to analyze trading strategies. Running backtests on CoinMarketCap data will lead to wildly incorrect results, poor conclusions, and a potential loss of funds.
Rebalance Period
This study will evaluate intraday rebalance periods ranging from 1 hour to 1 day. Starting at 1 hour, every whole hour period will be evaluated until we reach a 24 hour rebalance period. This means we will examine rebalancing every 1 hour, 2 hours, 3 hours, … , 23 hours, and 24 hours.
A rebalance period is the specific amount of time between each rebalance. Therefore, a rebalance period of 24 hours would result in a rebalance every day at the exact same time. Varying this time period will help us determine if the frequency of rebalances has historically affected portfolio performance. Learn more about rebalancing for cryptocurrency.
Asset Selection & Allocation
All assets that were available on Binance from May 3, 2018 to May 3, 2019 were included in this study except for the following stablecoins: USD, USDT, TUSD, PAX, USDC, USDS.
During the portfolio construction process, assets were randomly selected from the pool of assets available on Binance to create a portfolio of 10 assets. Each portfolio maintained evenly weighted allocations throughout the entire backtest. This means, at the end of each rebalancing event, every asset held 10% of the total value of the portfolio.
In addition to the number of assets for each portfolio being fixed, our study also fixed the initial value of each portfolio to $5,000.
While our study randomly selects assets, we strongly discourage this as a strategy for creating a portfolio. Learn more about how to successfully build a strong portfolio.
Backtest
Backtesting is the process of running a simulation of how a strategy would perform over a given set of data. This helps demonstrate the viability of a strategy without using real funds to test. In this study, we use backtests to compare the results of high frequency portfolio rebalancing to a simple buy and hold strategy. For each rebalance frequency, we run a set of 1000 backtests. This allows us to find trends and patterns in portfolio performance by graphing the outcomes of all these backtests. Read more about backtests or run your own.
Results
After running backtests for every hourly rebalance period from 1 hour to 24 hours, we graphed the median performance of the 1,000 backtests. What we found was the following graph.
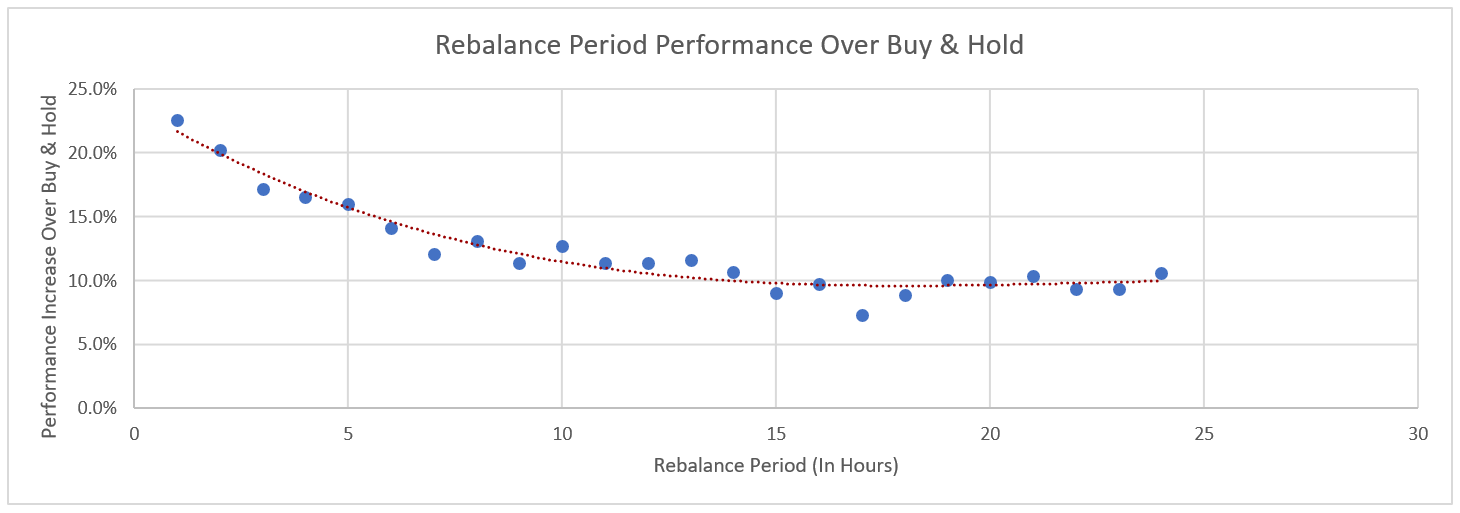
Each data point represents the median performance of 1,000 backtests. The x-axis represents the rebalance period used for each set of backtests, ranging from 1 hour to 24 hours. The y-axis is the performance increase over buy and hold. A performance increase of 10% therefore means rebalancing performed 10% better than buy and hold at that rebalance period.
These results demonstrate a clear trend for increased performance at shorter rebalance periods. As the rebalance period increases, we observe a stabilization around 10% performance increase over buy and hold. By shortening the rebalance period, we find the median performance increases to 22.55% at a 1 hour rebalance period.
The trend of increased performance at shorter rebalance periods has resurfaced throughout countless studies which evaluate rebalance performance. For example, our previous study which evaluates the effect of trading fees on rebalance performance found that lower trading fees tended to shift the optimal rebalance period towards shorter rebalance periods.
Crypto Portfolio Rebalancing: A Trading Fee Analysis
In addition to the affect of trading fees on performance, we’ve also found that exchanges with higher liquidity also have an affinity towards shorter rebalance periods being optimal. The following study compares rebalancing on Bittrex to Binance.
Exchange Liquidity — A Comparative Study
The final key characteristic that we should remember for this study is the affect of portfolio size on performance. Our backtests have found a trend towards shorter rebalance periods performing better when using more diverse portfolios.
Portfolio Diversity: A Technical Analysis
Detailed Results
The following results evaluate each rebalance period from 1 hour rebalance periods to 24 hour rebalance periods.
1 Hour Rebalance Period
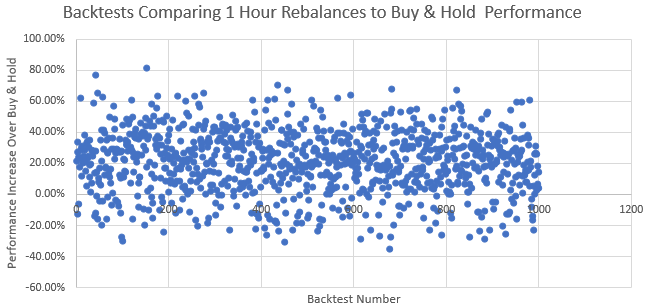
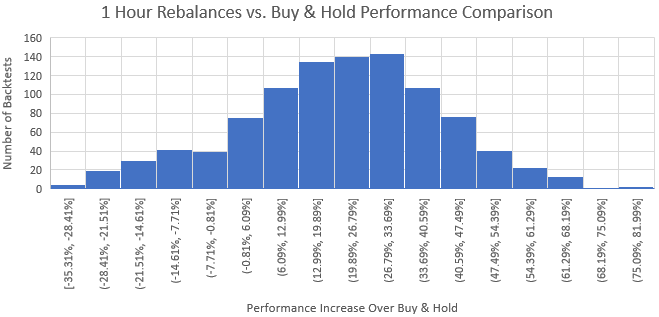
85.90% of the portfolios outperformed buy & hold.
Median performance increase over buy & hold: 22.55%
2 Hour Rebalance Period
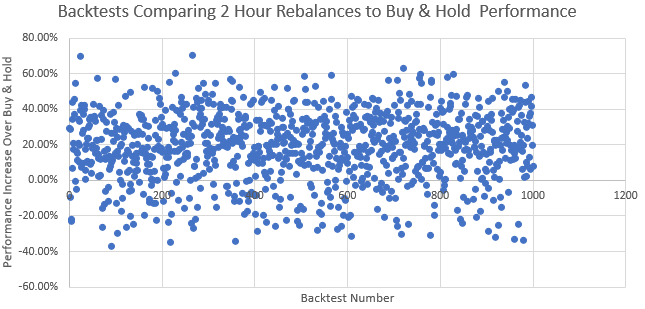
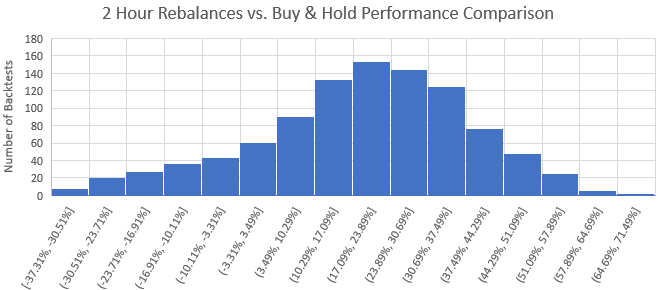
83.90% of the portfolios outperformed buy & hold.
Median performance increase over buy & hold: 20.29%
3 Hour Rebalance Period
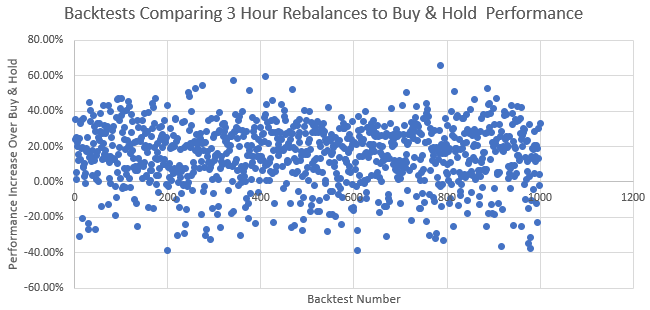
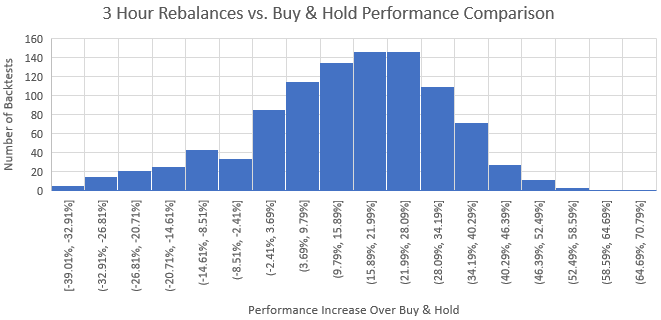
82.50% of the portfolios outperformed buy & hold.
Median performance increase over buy & hold: 17.18%
4 Hour Rebalance Period
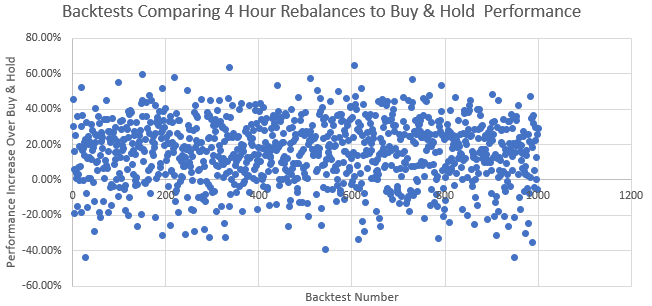
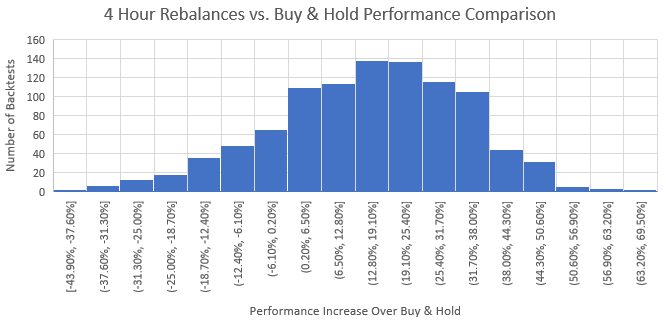
81.20% of the portfolios outperformed buy & hold.
Median performance increase over buy & hold: 16.65%
5 Hour Rebalance Period
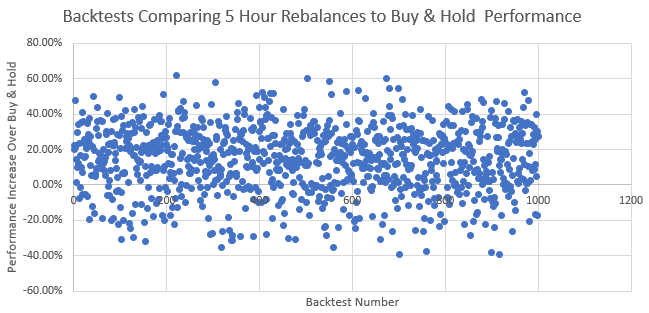
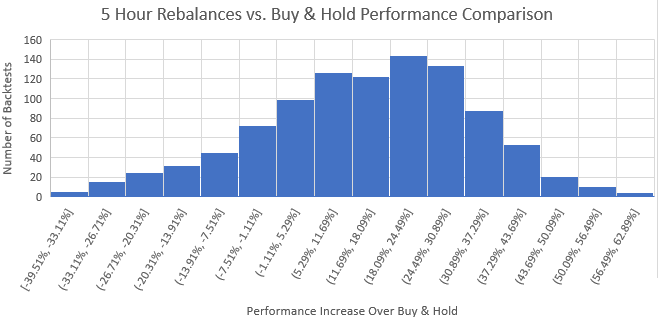
78.40% of the portfolios outperformed buy & hold.
Median performance increase over buy & hold: 16.01%
6 Hour Rebalance Period
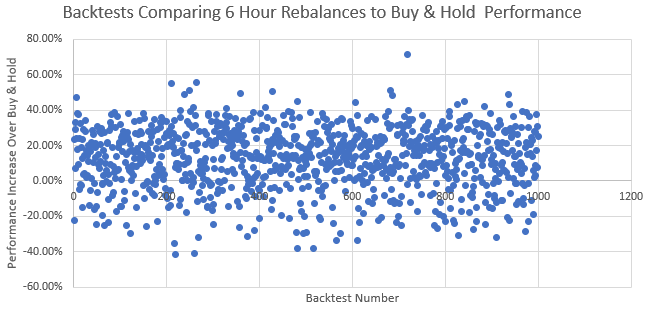
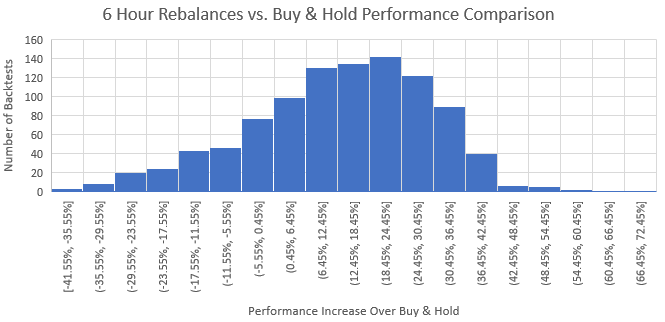
78.60% of the portfolios outperformed buy & hold.
Median performance increase over buy & hold: 14.11%
7 Hour Rebalance Period
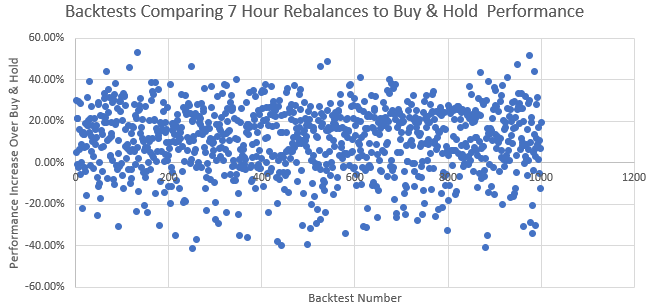
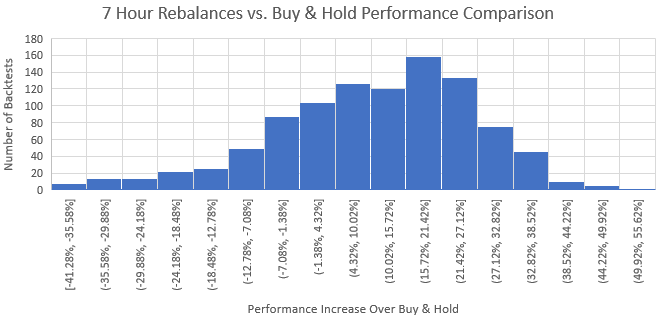
75.40% of the portfolios outperformed buy & hold.
Median performance increase over buy & hold: 12.15%
8 Hour Rebalance Period
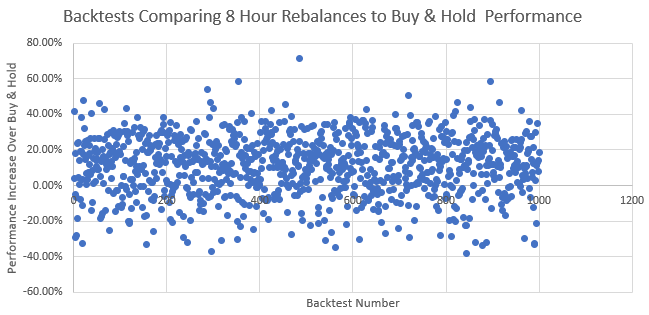
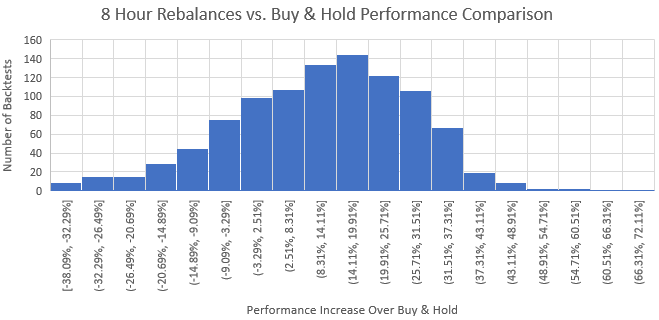
76.10% of the portfolios outperformed buy & hold.
Median performance increase over buy & hold: 13.19%
9 Hour Rebalance Period
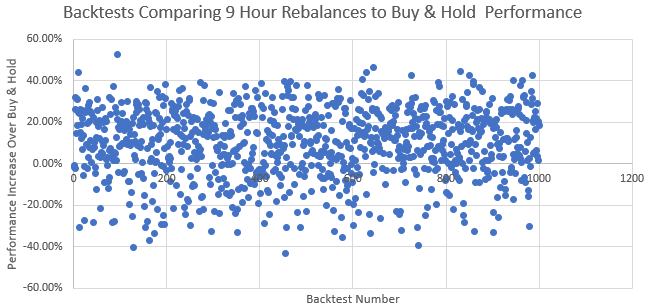
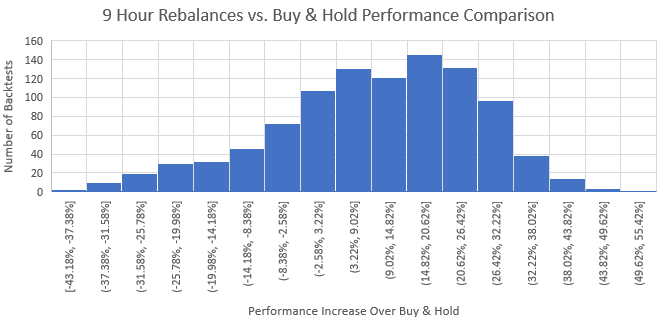
74.40% of the portfolios outperformed buy & hold.
Median performance increase over buy & hold: 11.43%
10 Hour Rebalance Period
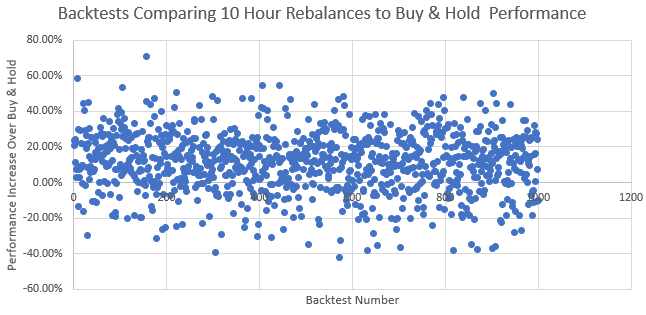
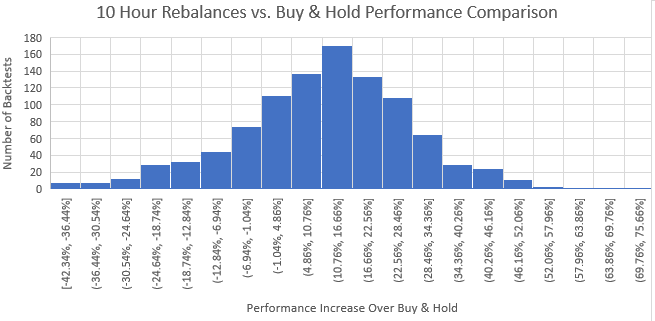
77.00% of the portfolios outperformed buy & hold.
Median performance increase over buy & hold: 12.75%
11 Hour Rebalance Period
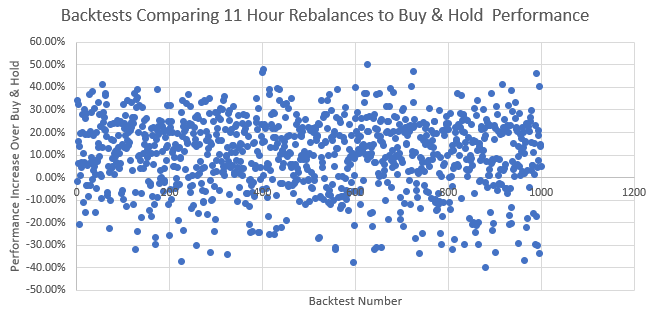
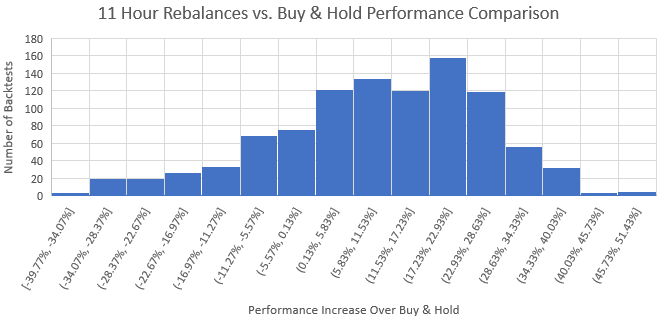
75.10% of the portfolios outperformed buy & hold.
Median performance increase over buy & hold: 11.37%
12 Hour Rebalance Period
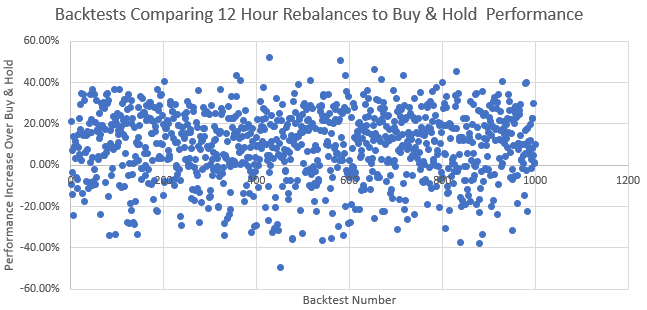

72.30% of the portfolios outperformed buy & hold.
Median performance increase over buy & hold: 11.34%
13 Hour Rebalance Period
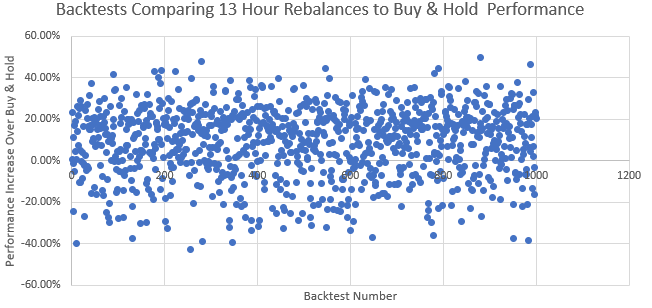
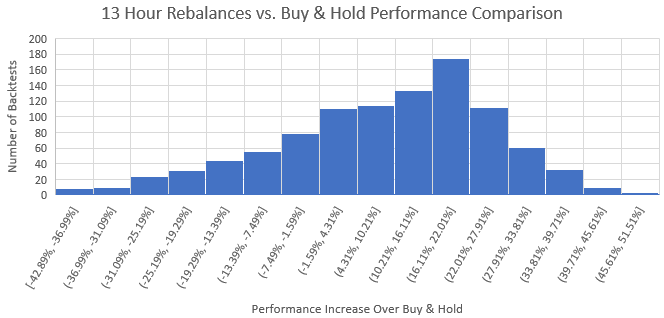
72.20% of the portfolios outperformed buy & hold.
Median performance increase over buy & hold: 11.69%
14 Hour Rebalance Period

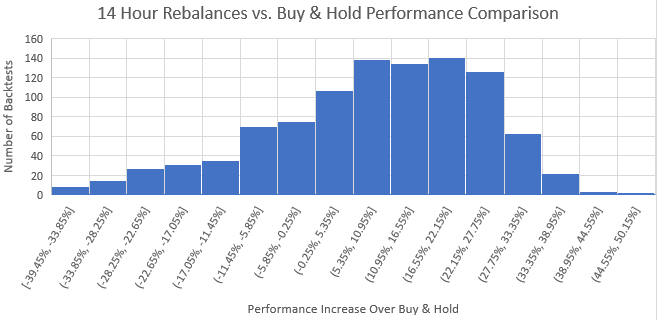
73.00% of the portfolios outperformed buy & hold.
Median performance increase over buy & hold: 10.74%
15 Hour Rebalance Period
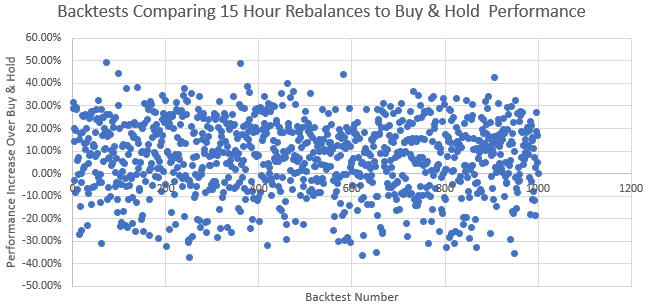
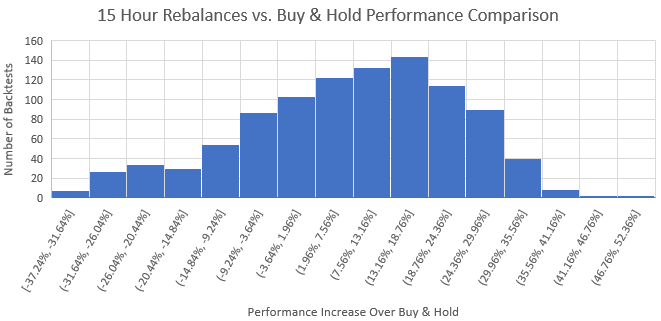
68.90% of the portfolios outperformed buy & hold.
Median performance increase over buy & hold: 8.99%
16 Hour Rebalance Period
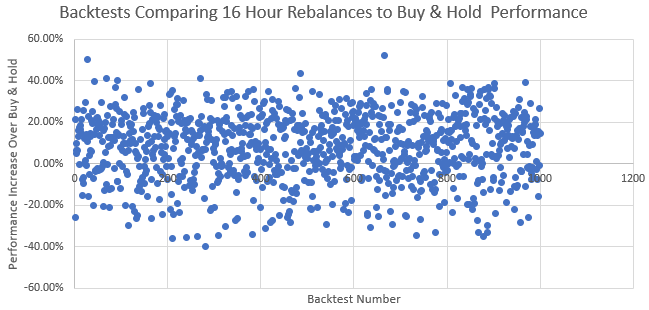
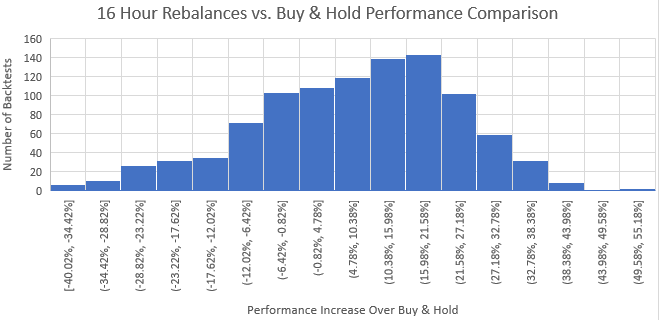
69.90% of the portfolios outperformed buy & hold.
Median performance increase over buy & hold: 9.77%
17 Hour Rebalance Period
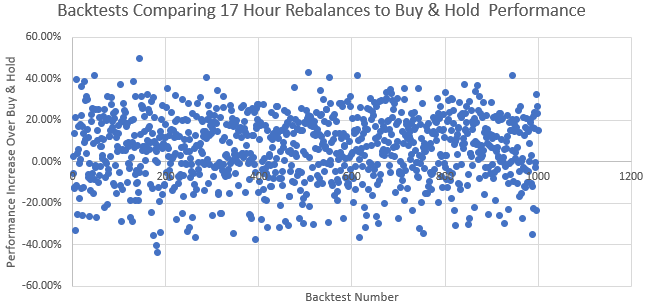
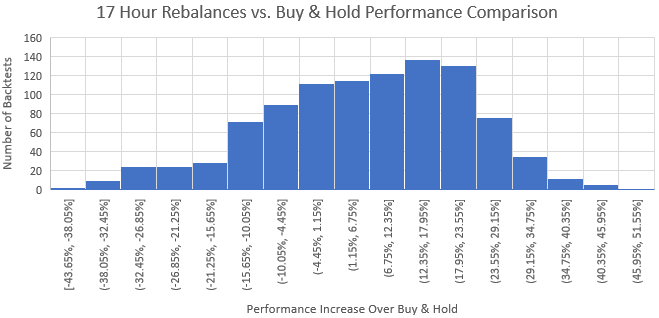
65.10% of the portfolios outperformed buy & hold.
Median performance increase over buy & hold: 7.39%
18 Hour Rebalance Period
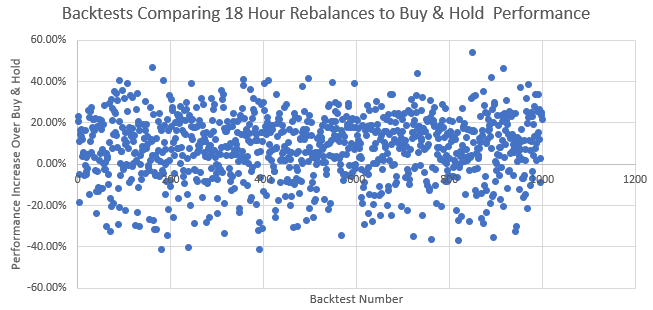
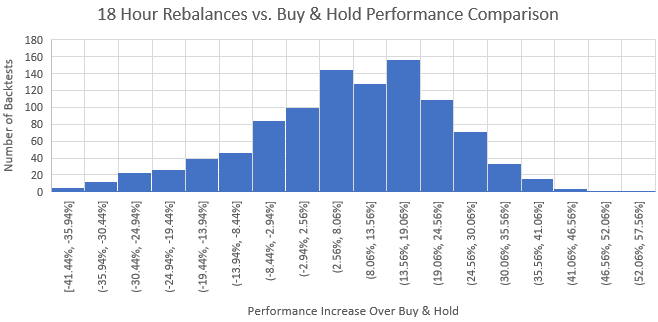
71.50% of the portfolios outperformed buy & hold.
Median performance increase over buy & hold: 8.90%
19 Hour Rebalance Period
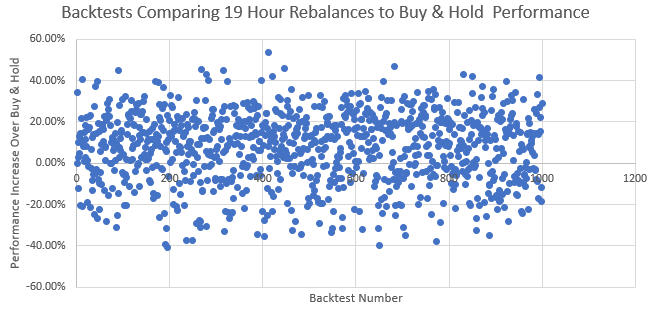
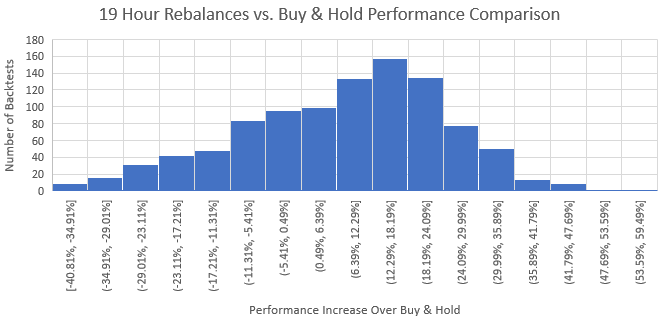
68.10% of the portfolios outperformed buy & hold.
Median performance increase over buy & hold: 10.02%
20 Hour Rebalance Period
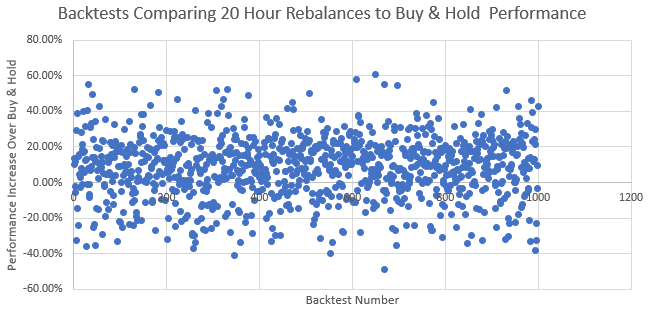
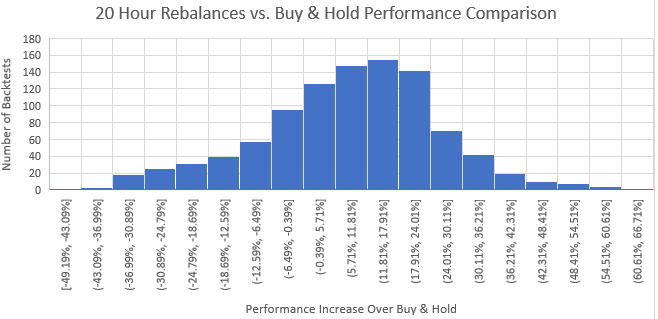
72.10% of the portfolios outperformed buy & hold.
Median performance increase over buy & hold: 9.88%
21 Hour Rebalance Period
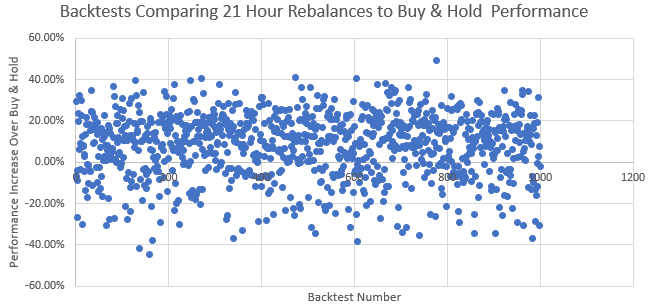
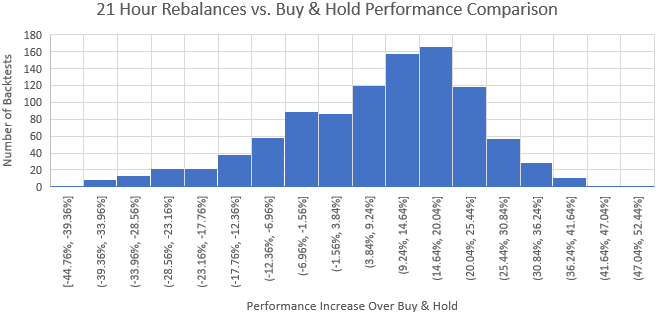
72.70% of the portfolios outperformed buy & hold.
Median performance increase over buy & hold: 10.41%
22 Hour Rebalance Period
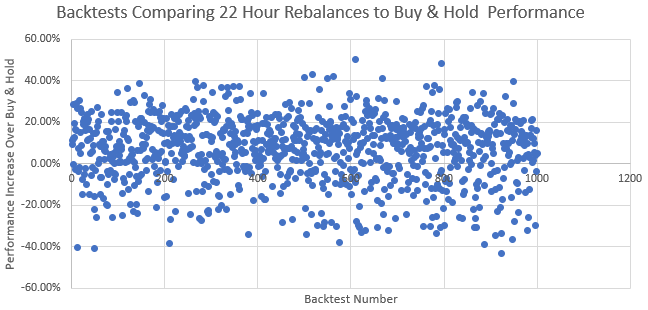
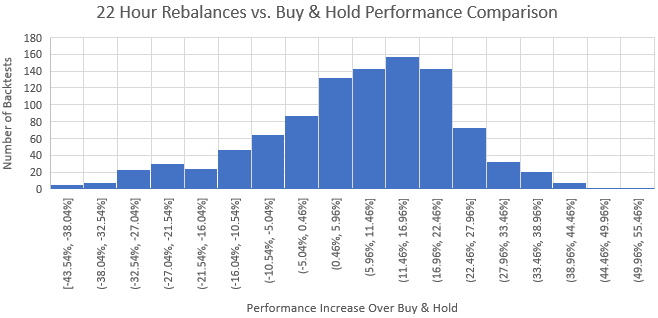
72.00% of the portfolios outperformed buy & hold.
Median performance increase over buy & hold: 9.41%
23 Hour Rebalance Period
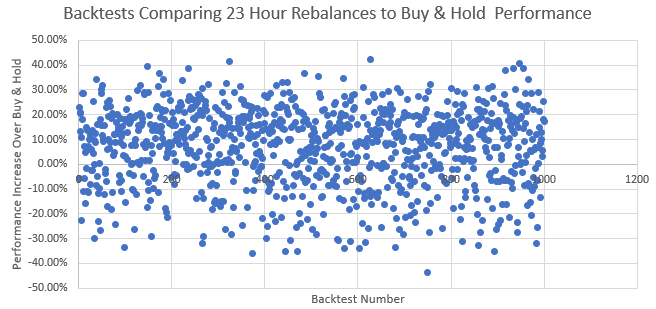
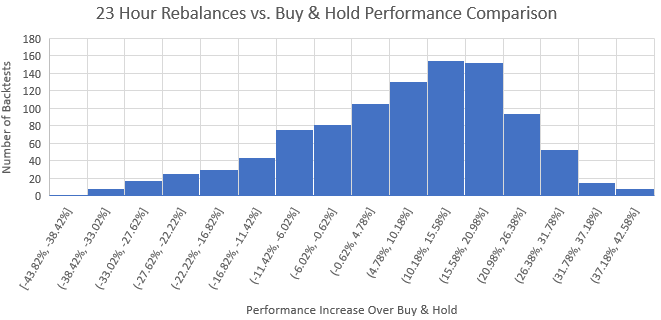
70.30% of the portfolios outperformed buy & hold.
Median performance increase over buy & hold: 9.34%
24 Hour Rebalance Period
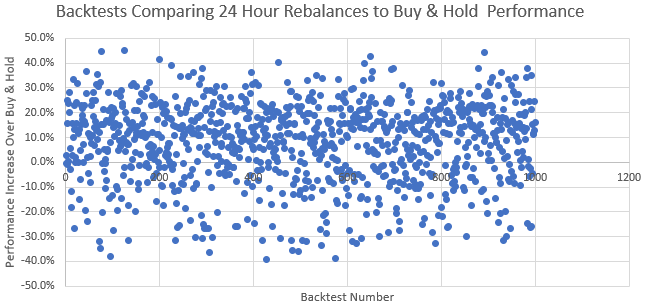
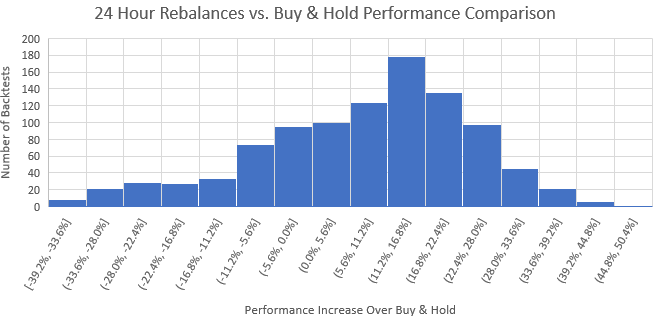
71.00% of the portfolios outperformed buy & hold.
Median performance increase over buy & hold: 10.6%
Conclusions
High frequency rebalancing is a new cryptocurrency portfolio strategy that was brought to the market by the Shrimpy application. The discovery that short rebalance periods have historically been optimal when implementing a rebalancing strategy on a highly liquid and low fee exchange, opens up a new way for crypto traders to engage in the market. Instead of manually adjusting positions as the market changes, Shrimpy is automatically able to capitalize on the volatility of cryptocurrencies.
In this study, our results align closely with all our previous publications on rebalance performance. We find shorter rebalance periods have outperformed longer rebalance periods up until the 1 hour frequency. The results suggest a 1 hour rebalance period was optimal during the one year period of time that was examined in this study.
A one hour rebalance period outperformed buy & hold by 22.55%.
Disclaimer: Backtests examine past performance and do not guarantee future performance.
About Shrimpy
Shrimpy is an automated crypto trading & portfolio management tool that lets users automate their crypto portfolio with only a few clicks. Shrimpy also supports the most advanced trading APIs for application developers.
Shrimpy Application
Shrimpy — Cryptocurrency Portfolio Management
The Shrimpy App is a portfolio management solution for cryptocurrency and digital asset owners. Through its unique indexing and rebalancing engine, Shrimpy lets traders manage their crypto assets similar to that of a traditional index fund. By providing a simple passive management solution, Shrimpy provides users with an effective long-term solution for managing their crypto assets without ever having to trade.
Shrimpy API
Shrimpy | Crypto Trading APIs for Developers
Shrimpy’s Crypto Trading API was created as a cloud-based solution to address several crypto developer roadblocks including Exchange Trading, Product Scalability, and User Management. With Shrimpy’s API in hand, developers can leverage our existing trading infrastructure and real-time data for application development instead of managing connections to each and every exchange on their own.
~The Shrimpy Team