
Crypto Traders That Diversify Perform Better (Updated 2019)

Over the course of the last two years, our team has run over 1,000,000 backtests.
That’s a lot of backtests.
These backtests have helped us construct some of the most complete studies available in the market today.
Time and time again, we came across a trend which many would find surprising. A simple way our backtests definitively showed that historically increased performance.
In an attempt to bring this simple strategy to the public, we put together a study which would highlight the strategy performance.
Throughout this study, we will compare the performance of a simple buy and hold strategy to portfolio rebalancing.
Although portfolio rebalancing isn’t the strategy we are focusing on in this article, we have also found portfolio rebalancing can potentially boost performance based on our historical backtests.
Learn more in our previous study here.
The actual strategy we are targeting in this study is the simple strategy of adding more assets to your portfolio.
That’s right, we’ve historically found adding more assets to your portfolio boosts returns.
So, let’s prove it!
The Setup
In this study, we will test portfolios ranging in size from 2 to 40 cryptocurrencies. That means by the end we will have 100,000 backtests to find the trends in our data.
The results of those backtests will be broken down by strategy type.
We will also convert the graphs to a simple line graph that shows the relationship between the number of assets in a portfolio and the median value of the portfolio at the end of a one year period.
The initial investment for each backtest is set to $5,000.
You can read more about the setup from our previous study here.
HODL
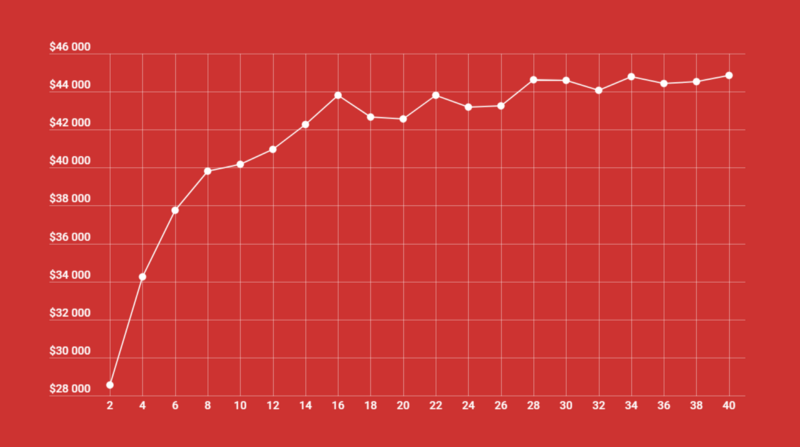
This graph shows the results of a $5,000 initial investment that used the HODL strategy for one year. Each data point on the graph is the median results of 1,000 backtests which were run by randomly selecting the number of assets on the x-axis.
This plot shows that HODLing approached an asymptote around $45k after a one year period.
As the number of assets increased past 16, there was a minimal observable difference in value.
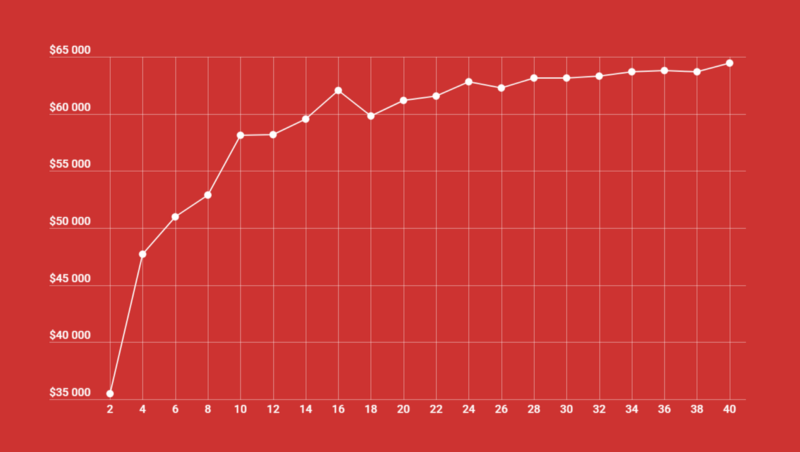
1 MONTH REBALANCE

This graph shows the results of a $5,000 initial investment that used 1 month rebalances for one year. Each data point on the graph is the median results of 1,000 backtests which were run by randomly selecting the number of assets on the x-axis.
This plot shows that a 1 month rebalance had an apparent asymptote around $60k after a one year period.
As the number of assets increased past ~22, there was a minimal observable difference in value.
1 WEEK REBALANCE
This graph shows the results of a $5,000 initial investment that used 1 week rebalances for one year. Each data point on the graph is the median results of 1,000 backtests which were run by randomly selecting the number of assets on the x-axis.
This plot shows that a 1 week rebalance had an apparent asymptote around $65k after a one year period.
As the number of assets increased past ~16, there was a minimal observable difference in value.
1 DAY REBALANCE

This graph shows the results of a $5,000 initial investment that used 1 day rebalances for one year. Each data point on the graph is the median results of 1,000 backtests which were run by randomly selecting the number of assets on the x-axis.
This plot shows that a 1 day rebalance had an apparent asymptote around ~$73k after a one year period.
As the number of assets increased past ~14, there was a minimal observable difference in value.
1 HOUR REBALANCE

This graph shows the results of a $5,000 initial investment that used 1 hour rebalances for one year. Each data point on the graph is the median results of 1,000 backtests which were run by randomly selecting the number of assets on the x-axis.
This plot shows that a 1 hour rebalance had an apparent asymptote around ~$145k after a one year period.
As the number of assets increased past ~18, there was a minimal observable difference in value.
COMBINED RESULTS

This graph shows the results of a $5,000 initial investment that used the strategies as discussed above. Each data point on the graph is the median results of 1,000 backtests which were run by randomly selecting the number of assets on the x-axis.
This plot compares the rebalance periods and their performance over the last year.
We can see that a 1 hour rebalancing strategy had significantly higher returns than other periods.
However, regardless of the strategy, this data suggests that a portfolio ranging from 14 to 22 assets had the highest performance potential per asset over the last year.
Above this range adding more assets didn’t provide a large increase in value, although it does provide some benefit.
Assets below this range resulted in a sharp decline in portfolio value.
Conclusions
The median portfolio value generally tended to increase with the number of cryptocurrencies over the last year.
Portfolios with a smaller number of assets typically benefited more from adding additional assets than those with a larger number of assets.
One concern that some people expressed was that there may be an inflection point. This would be a point at which adding more assets to a portfolio decreases the median value.
The results don’t appear to indicate any such inflection point.
Over the last year, portfolios holding more assets tended to outperform those holding fewer assets.
These results present an exciting idea for those entering the market. Sometimes the best strategies are not the most complex.
We can see from these historical results that traditional ideas still hold regarding how to approach asset management.
Leave a comment to let us know what you think about this strategy!
Rebalancing with Shrimpy
Over the past year, we have seen that rebalancing a diverse portfolio can significantly improve performance.
The Shrimpy website can help automate this entire process.
Quickly select assets, instantly allocate a portfolio, and rebalance on a consistent time period. Shrimpy is the easiest way to manage your portfolio.
Sign up by clicking here.
If you still aren’t sure, try out the demo to see everything we have to offer!
Additional Reading
Portfolio Rebalancing for Cryptocurrency
The Crypto Portfolio Rebalancing Backtest Tool
Shrimpy is a personal crypto portfolio management application. Connect each of your exchange accounts to begin automating your portfolio strategy. It only takes 5 minutes to set up, so try it out today!
Shrimpy’s Universal Crypto Exchange APIs are the only unified APIs for crypto exchanges that are specifically designed for application developers. Collect real-time trade or order book data, manage user exchange accounts, execute trading strategies, and simplify the way you connect to each exchange.
Follow us on Twitter and Facebook for updates, and ask any questions to our amazing, active communities on Telegram & Discord.