
Common Rebalance Scenarios in Crypto
This article will discuss some of the scenarios you will experience when using the Shrimpy application. In order to construct a sound strategy, we must first have a conceptual understanding of how different market situations impact our performance when rebalancing.
You can learn more about rebalancing here:
Portfolio Rebalancing for Cryptocurrency
The day is Wednesday, June 21, 2017. You’ve been watching your crypto portfolio all morning, when Ethereum starts crashing. Panic strikes every nerve in your body. Do you sell? Do you buy? In fright, you set a stop loss to trigger at $200. ETH was at $352 just minutes ago, so the fear of losing all of your funds gets to you. Did you make the right call? Continue reading to find out!
This article will be a conceptual discussion of common scenarios you might find yourself in if you rebalance your portfolio. For each scenario, I will discuss the advantages and disadvantages of rebalancing. These situations are by no means a complete guide, but it should provide a foundation for thought and investigation.
Each scenario will be presented in two manners. The first is how the portfolio will behave without rebalancing. The second is how the portfolio will behave if it has been rebalanced. In each case, a single asset’s price will be changing relative to the portfolio. So, it is assumed that the value of all other assets in the portfolio remains constant while the single asset fluctuates. This simplifies our tests and provides an easier way to understand each scenario. Each scenario has been marked with one or more dots that designate a rebalance event.
Pump and Dump
Let’s begin our discussion with the hallmark of the crypto market; the pump and dump. This is when a sharp value increase of an asset is followed by a sharp decline in asset. The result is a return to the original price.

This graph illustrates a pump and dump. The white line is the price of a single asset in a portfolio. The orange line is the value of the portfolio if the HODL strategy is used from beginning the end. The blue line is the value of the portfolio if a rebalance was performed at the white dot. Result: rebalancing results in greater returns than HODL for this type of pump and dump.
HODL
The results of HODL for this situation are simple. Since the beginning and ending price are both the same value, HODL will result in no change of value for the portfolio.
Rebalance
Pump and dumps provide an opportunity for rebalancing to capture returns for the portfolio. When rebalancing, we shave off some of the value generated by the volatile asset and spread the returns into other holdings. Since the price of the volatile asset returns to the original value, the net result of a rebalance anywhere along the pump or dump curve is a positive return for the portfolio.
Conclusion
Pump and dumps present an opportunity for rebalancing to increase your total holdings. These same opportunities are not available for portfolios which simply HODL through a pump and dump.
Flash Crash and Recovery
There have been several famous flash crashes which were followed by quick recoveries in crypto. The one discussed at the start of this article was when ETH flash crashed to 10 cents. This may not be a weekly event, but we can examine how rebalancing would have affected your performance during this flash crash and recovery.

This graph illustrates a flash crash and recovery. The white line is the price of a single asset in a portfolio. The orange line is the value of the portfolio if the HODL strategy is used from beginning the end. The blue line is the value of the portfolio if a rebalance was performed at the white dot. Result: rebalancing results in greater returns than HODL for this type of flash crash and recovery.
HODL
The results of HODL for this situation are the same as the pump and dump scenario. Since the beginning and ending price are both the same value, HODL will result in no change of value for the portfolio.
Rebalance
Rebalancing can capitalize on these flash crashes to result in a net positive increase in portfolio value. When rebalancing, we buy more of the volatile asset while it’s cheap. Since the price of the asset returns to the original value, the net result of a rebalance anywhere along the pump or dump curve is a positive return for the portfolio.
Conclusion
Catching flash crashes with rebalancing can increase the value of a portfolio. In order to highlight how significant this would have been in the case of the ETH flash crash, catching this flash crash would have resulted in up to a 1595x return for your portfolio. While this will likely never happen again, it’s not unlikely that smaller flash crashes with recoveries will take place which rebalancing can capitalize on. This illustrates how predicting the future isn’t possible in the crypto space. Creating a stop loss and selling ETH as described at the start of this article would have resulted in large losses. However, continuing to rebalance through the crash would have presented potential for incredible gains.
Sideways Movement
Our next situation is a simple sideways movement which takes place for a prolonged period of time. During this time, there are typically micro fluctuations, although the total value of the portfolio remains relatively flat. Although this situation is largely uneventful, we need to evaluate if it provides any opportunities for rebalancing or if it would simply be better to HODL.

Figure 1: This graph illustrates prolonged sideways movement in the market. The white oscillating line is the price of a single asset in a portfolio. The orange line is the value of the portfolio if the HODL strategy is used from beginning the end. The blue line is the value of the portfolio if a rebalance was performed at the white dot. Result: rebalancing results in greater returns than HODL for this type of sideways movement.

Figure 2: This graph illustrates prolonged sideways movement in the market. The white oscillating line is the price of a single asset in a portfolio. The orange line is the value of the portfolio if the HODL strategy is used from beginning the end. The blue line is the value of the portfolio if a rebalance was performed at each white dot. Result: rebalancing results in greater returns than HODL for this type of sideways movement.
HODL
When examining this case, the results of a portfolio which uses the HODL strategy is easy to imagine. There should be no net change in portfolio value. This means from the beginning to the end of these micro fluctuations, we won’t observe any increase or decrease in asset holdings.
Rebalance
Figure 1:
In figure 1, we see the one asset in the portfolio depicted by the white line reduces in value towards the white dot. At this time, the portfolio is rebalanced and the asset experiences accumulation. Then, when the asset increases in value back to the base line, what we end up seeing is an increase in portfolio value. This situation is present whether the rebalance happens at the valleys or peaks of these fluctuations. When the value of an asset returns to its previous value, it results in a net increase in value for rebalancing.
Figure 2:
In figure 2, we examine what happens when we continue to rebalance during prolonged periods of sideways movement. What we see here is that rebalancing during these micro fluctuations actually results in a compounding affect. As we continue to jump from peak to valley, the value of the portfolio continues to climb.
Conclusion
Sideways movement presents a possibility for rebalancing to capitalize on small fluctuations in asset value. Long periods of sideways movement can actually result in increases in portfolio value. In addition, rebalancing frequently can actually result in a compounding affect which boosts performance even further.
Slow Death
The slow death is when a single asset continues to decline in value. Week over week, it slowly continues to decrease in value.

This graph illustrates a slow death. The white line is the price of a single asset in a portfolio. The orange line is the value of the portfolio if the HODL strategy is used from beginning the end. The blue line is the value of the portfolio if a rebalance was performed at the white dot. Result: HODL beats rebalancing. The innovative investor should watch their portfolio to detect this type of slow decline.
HODL
HODLing an asset which is having a slow death results in a net decrease in total portfolio value. However, this slow death does not affect the value of any other holding. So while the total value of the portfolio is decreasing, the subset of the portfolio which excludes the asset which is having a slow death, does not have any decrease in value.
Rebalance
Rebalancing into an asset which is having a slow death decreases portfolio value. In addition to the value of the individual asset declining, it is actually also declining the value of the rest of the assets in the portfolio as well. So, this means that both this individual asset as well as the rest of the portfolio is bleeding.
Conclusion
This is a undesirable situation to be in when rebalancing. Continually rebalancing into a dying asset will drag the entire portfolio down with it. If you are using a periodic rebalancing strategy, it is important to monitor your assets to ensure this is not the case for your portfolio. Having a diverse portfolio will also mitigate these risks since a smaller percentage of the total portfolio value will be held by the single asset.
Slow Take Off
Let’s now look at what happens if we have a single asset in the portfolio which is continuously increasing in value. Over the long term, it continues on a general increasing trend.

This graph illustrates a slow climb. The white line is the price of a single asset in a portfolio. The orange line is the value of the portfolio if the HODL strategy is used from beginning the end. The blue line is the value of the portfolio if a rebalance was performed at the white dot. Result: HODL beats rebalancing. However, rebalancing offers an opportunity to reduce risk by shaving off some of your returns into other assets.
HODL
HODLing an asset which is slowly increasing in value results in a net increase for the portfolio. This slow incline has no affect on the rest of the portfolio, so the value increase from this asset is directly proportional to its own value increase over time.
Rebalance
Rebalancing an asset which is constantly increase results in shaving off profits and dumping them into the rest of the portfolio. Since this instance is discussing the behavior of a single asset, this would result in a dampening affect on the value increase for this single asset.
Conclusion
Steadily increasing asset value has advantages for both rebalancing and HODL. HODL generates larger returns if the rest of the portfolio value remains stagnant. The reason for this is that profits won’t be taken from the succeeding asset. In the other case, rebalancing has an advantage because a steady increasing asset that always wins is far more rare than many investors believe in the crypto market. This means a more typical case is one asset grows in value, but the next time it is a different asset that has great growth. In this case, it’s better to shave off some of the profits from one asset since the next time period may see a rise in a different asset.
Sharp Decline
A sharp decline is the case where the value of an asset in your portfolio drops quickly and then stabilizes to a new baseline value.
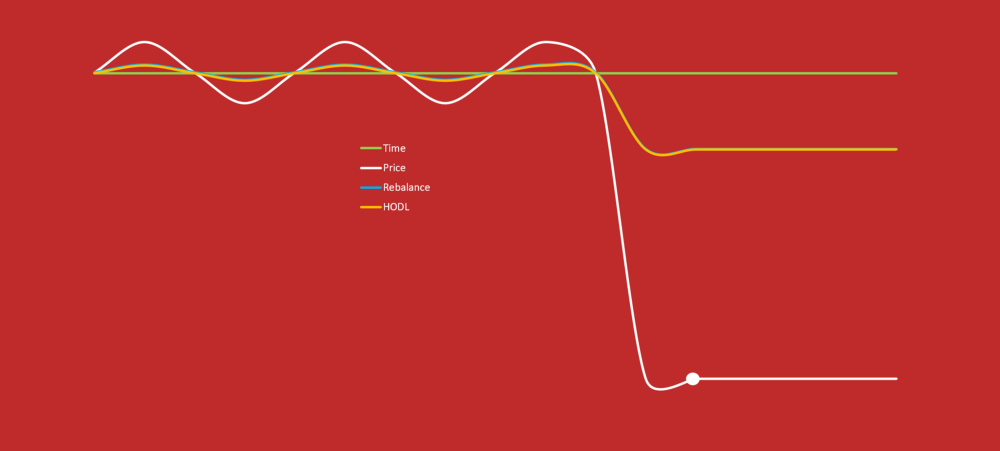
This graph illustrates a sharp decline and then stabalization. The white line is the price of a single asset in a portfolio. The orange line is the value of the portfolio if the HODL strategy is used from beginning the end. The blue line is the value of the portfolio if a rebalance was performed at the white dot. Result: rebalancing and HODL produce similar results for this type of sharp decline.
HODL
HODL of an asset which has a sharp decline simply results in the reduction of portfolio value directly proportional to its own value decrease over time.
Rebalance
The results for this situation are the same as those of HODL. While the single asset crash resulted in a net decrease for the portfolio, a rebalance at the dot does not introduce any additional loss in funds. Rebalancing anywhere along the decreasing line before the dot would result in additional loss (See “Slow Death”).
Conclusion
Both rebalancing and HODL perform the same in this instance when looking at the complete portfolio value. Rebalancing at the dot will accumulate more of the asset which had a sharp decline, however, the stabilizing price afterwards means no additional loss in portfolio value is observed.
Sharp Jump
Sharp jump is the situation where a single asset in your portfolio quickly increases in value until it reaches a new baseline value.

This graph illustrates a pump and then stabilization. The white line is the price of a single asset in a portfolio. The orange line is the value of the portfolio if the HODL strategy is used from beginning the end. The blue line is the value of the portfolio if a rebalance was performed at the white dot. Result: rebalancing and HODL produce similar results for this type of sharp jump.
HODL
HODL of an asset which has a sharp rise simply results in the increase of portfolio value directly proportional to its own value increase over time.
Rebalance
The results for this situation are the same as those of HODL. While the single asset pump resulted in a net increase for the portfolio, a rebalance at the dot does not introduce any additional gain in funds. Rebalancing anywhere along the increasing line before the dot would result in under performing when compared to HODL (See “Slow Take Off”).
Conclusion
Both rebalancing and HODL perform the same in this instance when looking at the complete portfolio value. Rebalancing at the dot will redistribute some of the gains observed during the sharp incline, however, the stabilizing price afterwards means no additional gain in portfolio value is observed.
Wrap Up
This concludes some of the common situations that you will likely observe in the crypto market. Due to the volatile and unpredictable nature of the market, it’s impossible to predict what the future holds. However, understanding some of the common situations and identifying them early can potentially help the decision making process on whether or not you should rebalance your portfolio.
Once again, we understand this is not a comprehensive list of all situations which can be encountered in the market. The purpose of the article was to highlight some cases which would encourage our users to begin thinking about the possible situations and how they may affect their portfolio performance.
Let us know if you have questions and what other scenarios or real world examples you’d like us to look at!
Additional Reading
Rebalance vs. HODL: A Technical Analysis
Crypto Users who Diversify Perform Better
Shrimpy leads the market as the premier portfolio management application. Users are able to configure a custom crypto portfolio and implement a passive rebalancing strategy, removing the hassle of having to actively trade crypto.
Shrimpy Web Application: Shrimpy - Cryptocurrency Portfolio Management
Shrimpy’s Developer Trading API is a unified way to integrating trading functionality across every major exchange. Collect historical market data, access real-time websockets, execute advanced trading strategies, and manage an unlimited number of users.
Shrimpy Crypto Trading API: Shrimpy | Crypto Trading APIs for Developers
Don’t forget to follow us on Twitter and Facebook for updates, and ask any questions to our amazing, active community on Telegram.
The Shrimpy Team