
Machine Learning for Crypto Portfolio Management Case Study: Week 32

Announcement: Binance will be blocking any remaining US customers from accessing the Binance exchange. That means the Shrimpy team will need to migrate this study to another exchange in the coming weeks. The transition will not happen this week, but we will keep everyone updated with the latest information about the migration as we learn more. We will do everything we can to make the transition as smooth as possible.
Over the last 8 months, our team has been tracking the performance of 4 different portfolio strategies. These include portfolios selected using Machine Learning, CoinGecko, market-cap indexing, and a simple Bitcoin HODL.
The last week was less eventful than previous weeks, but there is still a lot to learn from the data. While some assets are falling, others have been steadily rising over the last few weeks. It feels like a build up to alt season, so we can’t wait to see what happens next. Keep reading for the results!
Reminder: The methodology for this study was first outlined in our previous article.
Follow the progress of this study on Shrimpy.
Week 31 Results
The study so far has been a steady mix of shock and awe. Last week was no exception. Bitcoin stalled, but still held above $19,000. By the end of the week, Bitcoin settled for a small gain of 0.74%.
After months of asking the question of whether Bitcoin will ever catch up to the performance of the machine learning strategy, we can definitively say: Yes. However, that doesn’t mean the performance caught up for long. After only two weeks of teasing the possibility of overtaking other strategies a few weeks ago, Bitcoin fell through the rankings to once again become the second-worst performing portfolio. Yet, Bitcoin is more than capable of catching and even surpassing the performance any other strategy in this study. We still wonder if it will be able to maintain its trajectory and continue the steady growth.
#1 Bitcoin

Bitcoin saw minor gains throughout this last week. The small movements throughout the week resulted in a 0.74% final price increase. Although Bitcoin stalled, it still held steady while some other assets were experiencing volatility. The continued growth for Bitcoin over the last month paints a hopeful future for Bitcoin soon breaking $20,000.
Bitcoin is now the second-worst performing portfolio in this study.
Final Bitcoin portfolio value: $2,251.58.
#2 Top 10 Index

Due to the stable value of Bitcoin, it was expected that a portfolio based on a market-weighted index would also experience similar performance over the course of the last week since Bitcoin held approximately 77% of the value in the portfolio.
After 8 months of rebalancing the index-based portfolio, it’s interesting to see how the performance has compared to a portfolio comprised of only Bitcoin. Although the performance is comparable, we’ve seen the performance of the index portfolio steadily outperform Bitcoin.
Final Top 10 Index portfolio value: $2,306.89.
#3 Coin Gecko

The Coin Gecko portfolio had a week of minor losses. With a final loss of -1.74%, Coin Gecko became the worst-performing portfolio, losing out to Bitcoin.
CoinGecko is the worst performing portfolio out of the 4 portfolios being studied.
The biggest winners selected by the Coin Gecko strategy were:
Monero (XMR): +11.14% Last 7 days
Stellar (XLM): +2.81% Last 7 days
The biggest losers selected by the Coin Gecko Strategy this week:
XRP (XRP): -17.15% Last 7 days
TRON (TRX): -3.58% Last 7 days
EOS (EOS): -3.39% Last 7 days
Coin Gecko is the worst performing portfolio since the beginning of the study. This last week saw a mediocre selection of assets. This could be attributed to some large-cap assets having nearly no performance changes over the last week.
Final Coin Gecko portfolio value: $2,204.87.
#4 Nomics ML
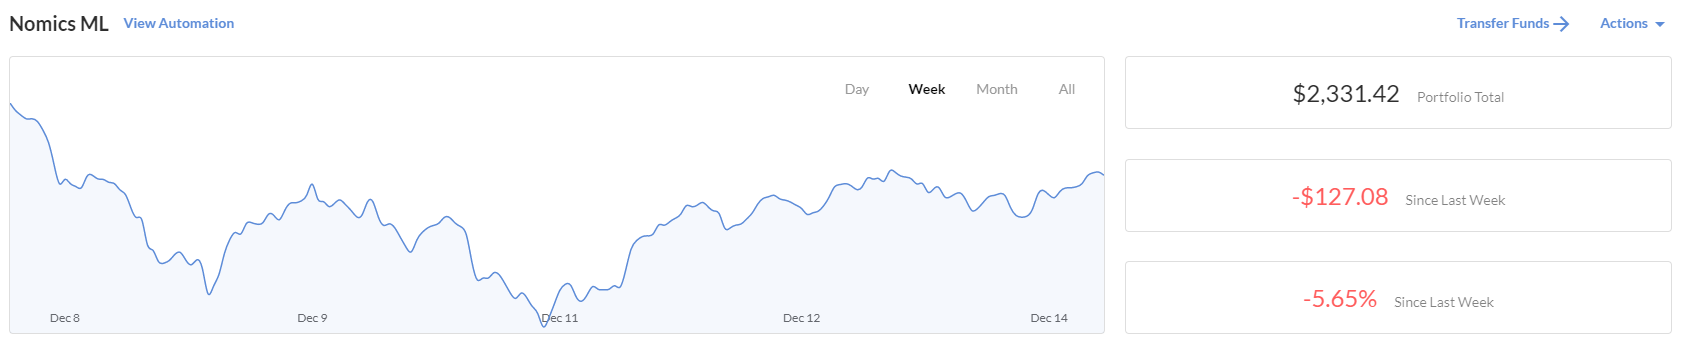
The Nomics Machine Learning strategy has kept its lead but was the second-worst performing portfolio this week. With a projected profit for this week of 21.14%, the last 7 days wildly underperformed the projections with a -5.65% performance change. This week, the price predictions definitely did not live up to our expectations.
The biggest winners selected by the Nomics ML strategy were:
NEM (XEM): +4.73% Last 7 days
Decred (DCR): +2.31% Last 7 days
The biggest losers selected by the machine learning strategy this week were:
Hedera Hashgraph (HBAR): -11.00% Last 7 days
VeChain (VET): -9.78% Last 7 days
Band Protocol (BAND): -7.84% Last 7 days
Terra (LUNA): -6.16% Last 7 days
Zilliqa (ZIL): -5.15% Last 7 days
Kusama (KSM): -5.02% Last 7 days
Waves (WAVES): -3.89% Last 7 days
After weeks of volatile performance, it’s difficult to know what to expect from Nomics week to week. Nomics was able to identify 2 assets that performed positively. Hopefully, the machine learning strategy can continue the trend and turn the previous losing streak around.
Final Nomics ML portfolio value: $2,331.42.
Conclusions
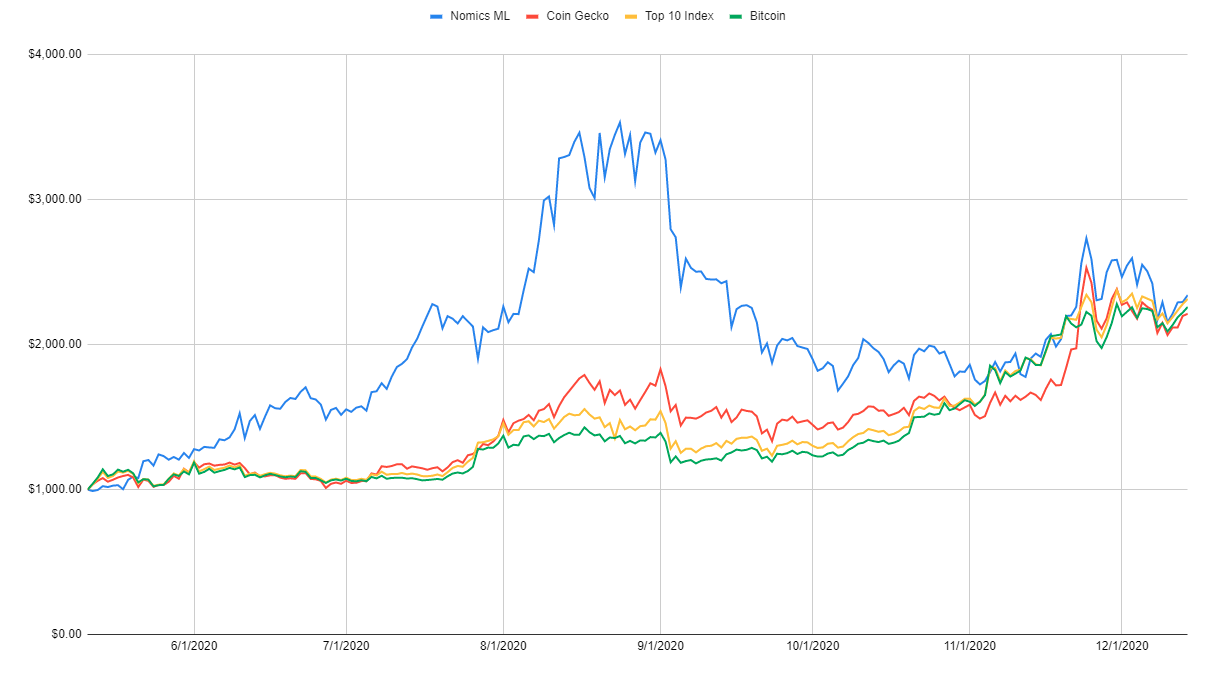
The Nomics ML strategy has maintained a lead over the other strategies since the second week of this study. Although other strategies began closing the gap over the last few months, the recent growth by the Machine Learning Strategy suggests this could be turning around.
We can’t wait to see what the next weeks bring.
Note: The conclusions drawn here are based on anecdotal evidence. Please take them with a grain of salt.
The purpose of this study is to evaluate each of these strategies over the long-term. We cannot yet draw any conclusions for the long-term potential of these strategies after only a few months. As a result, we should take these results with a grain of salt.
Notable Leaders
We are excited to see the Nomics ML case study has inspired a wave of leaders that are leveraging the Nomics data to implement novel strategies.
This week, we will be highlight XTSLabs, which has ported a similar version of the MLCaseStudy portfolio to Coinbase Pro, Bittrex, and Binance US. However, he has added elements of rebalancing in an attempt to maximize the results of the Nomics portfolio strategy.
XTSLabs
XTSLabs currently runs 3 different leader profiles. These leader profiles include:
XTSLabsCBP - A Nomics ML portfolio being automated on Coinbase Pro.
XTSLabsBinUS - A Nomics ML portfolio being automated on Binance US.
XTSLabsBittrex - A Nomics ML portfolio being automated on Bittrex.
Unlike the MLCaseStudy portfolio that is managed by the Shrimpy team, these portfolios leverage a 1% threshold rebalance. That allows each of these portfolios to rebalance throughout the week as the market becomes volatile.

With a portfolio change of -3.87% on Bittrex over the last 7 days, XTSLabsBittrex has outperformed 9% of leaders on Shrimpy. This is not the strongest week for the machine learning price predictions, but there is certainly still room for improvement.
XTSLabs was also kind enough to provide the balance changes for these portfolios over time. Starting with an initial $1,000 balance for each portfolio, we can see how the performance of running this machine learning strategy changes based on the exchange.
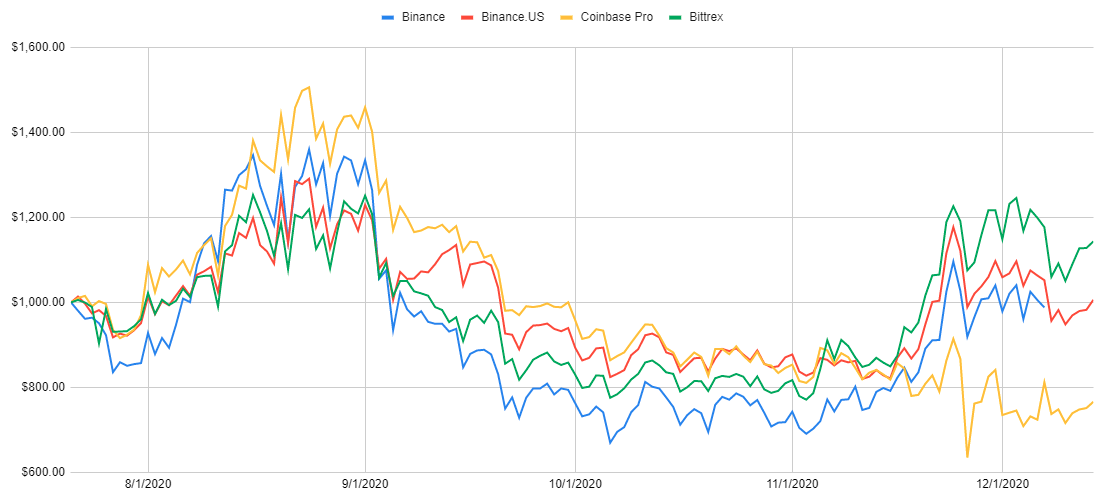
The Bittrex portfolio has overtaken Coinbase Pro as the best performing portfolio out of the 3 different exchanges that are supported by XTSLabs.
Week 32 Strategy Changes
Now that we have covered the results from the last week, it’s time to break down how we will change each of these portfolios for the coming week.
Nomics ML Strategy
The Nomics ML Strategy leverages the 7-day price predictions generated by the Nomics ML engine. These price predictions are then used to determine which assets should be placed into our portfolio for this week. Additional information regarding the methodology can be found in our previous article.
Portfolio Allocations
The following assets were allocated exactly 10% of the portfolio value for the second week of this study.
1. Blockstack (STX)
Projected 7-day profit: +22.14%
2. Kusama (KSM)
Projected 7-day profit: +11.61%
3. Decentraland (MANA)
Projected 7-day profit: +10.55%
4. Cardano (ADA)
Projected 7-day profit: +8.47%
5. THORchain (RUNE)
Projected 7-day profit: +7.49%
6. Loopring (LRC)
Projected 7-day profit: +7.45%
7. NEM (XEM)
Projected 7-day profit: +6.98%
8. Chainlink (LINK)
Projected 7-day profit: +6.37%
9. Binance Coin (BNB)
Projected 7-day profit: +4.19%
10. Bancor (BNT)
Projected 7-day profit: +3.82%
Reminder: We are only including the assets that are available on Binance in this portfolio.
The average performance estimate is 8.9% for the next 7 days for this portfolio.
Coin Gecko Score Strategy
The Coin Gecko Score Strategy uses the “Gecko” score that is calculated by the popular data site “CoinGecko”. These asset scores are used to determine the most promising long-term assets that should be included in a portfolio. Additional information regarding the methodology can be found in our previous article.
Update: Unfortunately, sometime over the last few weeks, Coin Gecko has decided to stop publishing a “Gecko” score. We are unsure why this is the case, but this will force us to use the last “Gecko” score we were able to collect from their website.
Portfolio Allocations
The following assets were allocated exactly 10% of the portfolio value for the first week of this study.
1. Bitcoin (BTC) - Last Available Score: 82%
2. Ethereum (ETH) - Last Available Score: 74%
3. EOS (EOS) - Last Available Score: 68%
4. XRP (XRP) - Last Available Score: 67%
5. Stellar (XLM) - Last Available Score: 65%
6. Bitcoin Cash (BCH) - Last Available Score: 65%
7. TRON (TRX) - Last Available Score: 64%
8. Chainlink (LINK) - Last Available Score: 64%
9. NEO (NEO) - Last Available Score: 63%
10. Monero (XMR) - Last Available Score: 63%
Note: From now until the end of the study, the Coin Gecko assets will remain the same. All assets will maintain a 10% allocation and rebalance to re-align current allocations with the target allocations.
Coin Market Cap Index Strategy
The Coin Market Cap Index Strategy uses the asset market caps that are calculated by “CoinMarketCap” to determine which assets should be included in the portfolio. Additional information regarding the methodology can be found in our previous article.
Portfolio Allocations
The allocations for the Top 10 Index portfolio strategy will be the following this week.
1. Bitcoin (BTC): 76.56% Allocation
2. Ethereum (ETH): 14.3% Allocation
3. XRP (XRP): 2.09% Allocation
4. Litecoin (LTC): 1.16% Allocation
5. Bitcoin Cash (BCH): 1.1% Allocation
6. Chainlink (LINK): 1.08% Allocation
7. Cardano (ADA): 1.04% Allocation
8. Polkadot (DOT): 0.93% Allocation
9. Binance Coin (BNB): 0.93% Allocation
10. Stellar (XLM): 0.81% Allocation
Note: No assets were added or removed from the index this week. We will just adjust the allocations to match the new percentages and execute a single rebalance operation.
Bitcoin Hold Strategy
The most simple of the strategies we will be exploring is a simple Bitcoin HODL. The Bitcoin HODL strategy will allow us to benchmark these other strategies against the price performance of Bitcoin. Additional information regarding the methodology can be found in our previous article.
Portfolio Allocations
100% Bitcoin
Note: There will be no changes or rebalances for the Bitcoin HODL portfolio.
Follow Along with Shrimpy
Everyone can follow along with this study by tracking the portfolio changes and performance inside the Shrimpy application. We have created a leader on the Binance exchange named MLCaseStudy. This leader will be updated on a weekly basis to include the latest portfolio allocations.
Follow MLCaseStudy on Shrimpy.
Disclaimer
The Content is for informational purposes only, you should not construe any such information or other material as legal, tax, investment, financial, or other advice. Nothing contained on our Site constitutes a solicitation, recommendation, endorsement, or offer by Shrimpy or any third party service provider to buy or sell any securities or other financial instruments in this or in any other jurisdiction in which such solicitation or offer would be unlawful under the securities laws of such jurisdiction.
All Content on this site is information of a general nature and does not address the circumstances of any particular individual or entity. Nothing in the Site constitutes professional and/or financial advice, nor does any information on the Site constitute a comprehensive or complete statement of the matters discussed or the law relating thereto. You alone assume the sole responsibility of evaluating the merits and risks associated with the use of any information or other Content on the Site before making any decisions based on such information or other Content. In exchange for using the Site, you agree not to hold Shrimpy, its affiliates or any third party service provider liable for any possible claim for damages arising from any decision you make based on information or other Content made available to you through the Site.