
The Best Threshold for Cryptocurrency Rebalancing Strategies

This study will stand as the first major analysis of threshold based rebalancing for cryptocurrency portfolios. The objective of this study is to not only accurately describe the historical performance of threshold rebalancing, but compare the results to those of a simple buy and hold strategy as well as periodic rebalancing. Due to the recent announcements of our support for threshold rebalancing in our portfolio management application, it is appropriate for us to thoroughly understand the historical implications of executing this strategy over long time periods.
To provide a foundation for understanding of how threshold rebalancing works, we’ve published a brief explanatory piece which will walk you through the strategy and how it has been implemented in Shrimpy. Before continuing, we recommend at least skimming that article here:
Threshold Rebalancing - The Evolution of Cryptocurrency Portfolio Management
Now that you have a general understand of how threshold based rebalancing works, stay up to date with all the studies we release on portfolio strategies by joining our Telegram group.
Past studies which evaluated the performance of periodic rebalancing can be found on our blog here.
Introduction
Before we get to the data, let’s discuss the methods for how this study was set up. Without a robust understanding of the way the study was conducted, we can’t rely on the accuracy of the results.
Data & Trade Calculations
The data for this study was collected directly from the Bittrex cryptocurrency exchange through the third party service CoinAPI. CoinAPI is a data provider which collects and archives order book data across every major cryptocurrency exchange. Using the data APIs, developers are able to access this data for backtests, market analytics, and even real-time pricing data. Our team collected each historical order book snapshot from CoinAPI such that we were provided with exact bid-ask pricing data. This ensures the simulated rebalances will be as accurate as possible when calculating trades.
Caution: Only exact bid-ask data should be used when running backtests. Using aggregated data from CoinMarketCap or other similar services will result in highly inaccurate calculations. Shrimpy studies have never been compromised by the use of such data.
The data for this study begins on March 15, 2017 and extends until June 20, 2019. This includes both the bull run of 2017 and the bear market of 2018 in an attempt to highlight a complete market cycle.
During each simulated rebalance, trades will be calculated by routing each trade through BTC. Each of these simulated trades will include the .25% trading fee which is standard for Bittrex. That means if our portfolio is selling LTC for ETH for example, the backtest will simulate 2 trades, one from LTC to BTC and one from BTC to ETH. Both of these trades will incur the .25% trading fee. Note that in this example Bittrex does have a direct ETH-LTC market. For simplicity our backtests will not consider these optimizations.
There are more advanced algorithms available for how to execute rebalances. In a previous article of ours, we discuss more intricate algorithms. You can find this article here:
Portfolio Rebalancing Algorithms In Crypto (Part I)
Threshold
The thresholds used in this study range from 1% to 50%. After the initial 1% threshold, the backtests evaluated each 5% increment. Therefor evaluating 5%, 10%, 15%, and so on, up until 50%. This provided us with a wide range of thresholds to evaluate in the hopes of identifying a trend.
Threshold rebalancing is a strategy which employs deviation bands (aka “thresholds”). When an individual asset deviates from its target allocation such that the current allocation is outside the deviation bands for this asset, the entire portfolio is rebalanced. This means even if a single asset crosses the threshold, every asset is rebalanced.
In this study, the deviation each asset exhibits is compared to the target allocation on an hourly period. That means once an hour, the data is evaluated and determined if the threshold has been crossed. If the threshold has been crossed, a rebalance is triggered. Therefore, the maximum rebalancing frequency that can be obtained is an hourly rebalance.
Portfolio Size & Asset Selection
During the portfolio construction process, each portfolio is allocated 10 assets. These ten assets are randomly selected from the available assets over the time period of March 15, 2017 to June 20, 2019. That means if the asset was not available throughout the entire period, the asset is not included in this study.
The follow assets are those which were included in this study:
ABY, AEON, AMP, ARDR, BAY, BITB, BLK, BLOCK, BTC, BTS, BURST, CLOAK, CRW, CURE, DASH, DCR, DGB, DGD, DMD, DOGE, EMC, EMC2, ETC, ETH, EXCL, EXP, FCT, FLDC, FLO, FTC, GAME, GEO, GRC, GRS, IOC, ION, IOP, KMD, KORE, LBC, LSK, LTC, MAID, MEME, MONA, MUE, NAV, NEOS, NLG, NXS, NXT, OK, PINK, PIVX, POT, PPC, QWARK, RADS, RDD, REP, SBD, SHIFT, SIB, SLR, SLS, SPHR, STEEM, STRAT, SWT, SYNX, SYS, TX, UBQ, VIA, VRC, VTC, WAVES, XDN, XEM, XLM, XMR, XRP, XST, XVG, XWC, XZC, ZCL, ZEC.
Our team has been fascinated with the way portfolio diversity affects performance. For a complete study on the topic, please visit our previous study here:
Crypto Users who Diversify Perform Better
Backtesting
To analyze each percent threshold, our study will combine the results of 1,000 backtests. The outcome is a histogram at each threshold which provides a distribution which can be both visually and analytically studied. In total 15,000 backtests were run for this study.
At the beginning of each backtest, the portfolio was seeded with $5,000 of initial capital which was used to construct the portfolio and rebalance throughout the backtest. For the sake of simplicity, the portfolio was allocated as an evenly distributed portfolio. That means each of the 10 assets were given exactly 10% weight in the portfolio.
If you’re interested in learning more about how different distributions affect performance, we published a study on this topic here:
Optimizing Asset Distribution For Cryptocurrency Rebalancing
Performance Calculations
At the end of the day, none of this matters if we don’t calculate performance in a way which people understand.
At the conclusion of each backtest, the result is a single dollar amount which is the value of the portfolio. This value is received for both rebalanced backtests and backtests which used the HODL strategy. The two resulting values are compared to one another in the following way to calculate performance:
Performance = ((R - H) / H) x 100
where,
R is the value of the rebalanced portfolio.
H is the value of the HODLed portfolio.
The result is multiplied by 100 to convert from a decimal to a percent.
Results
The following results will cover 15,000 backtests in an attempt to evaluate the performance difference between portfolios which were historically rebalanced and those which have HODLed. As an extra resource at the end, these results are compared to those which have used a periodic rebalancing strategy instead of threshold rebalancing.
In each section, we evaluate 4 primary attributes for the distribution. These attributes are the following:
Primary Performance Distribution: The range for which the majority of the backtests fall in the performance distribution. We calculate this range by taking the first bucket which has more than 10 backtests in the range and include all backtests until there are less than 10 backtests in a bucket.
Percent of Threshold Backtests that Outperformed HODL: The percent of portfolios which performed better using a threshold based rebalancing strategy instead of HODLing.
Average Performance Increase: The average percent boost that was observed for a portfolio that used the threshold rebalancing strategy instead of HODLing.
Median Performance Increase: The median percent boost that was observed for a portfolio that used the threshold rebalancing strategy instead of HODLing.
Threshold Rebalancing Backtests
Results from the threshold rebalancing backtests.
1% Threshold

Figure 1: The above histogram compares the percent performance of threshold rebalancing to a buy and hold strategy. The x-axis represents the performance increase over buy and hold for each backtest. The y-axis is the number of backtests which fall into each of the performance ranges on the x-axis. The process for constructing this histogram is therefore - once a backtest is complete, the portfolio value of the rebalance portfolio is compared to that of the HODLed portfolio using the methodology outlined in the section titled “Performance Calculations”. From this comparison, we receive a percent which represents how much better or worse rebalancing performed than HODL. Based on this percent, we increment the count for the number of backtests which fell into the corresponding performance range.
Primary Performance Distribution: -89.9% to 337.3%
Percent of Threshold Backtests that Outperformed HODL: 76.6%
Average Performance Increase: 101%
Median Performance Increase: 84%
1% Threshold Median Portfolio Performance: 84%
5% Threshold

Figure 2: The above histogram compares the percent performance of threshold rebalancing to a buy and hold strategy. The x-axis represents the performance increase over buy and hold for each backtest. The y-axis is the number of backtests which fall into each of the performance ranges on the x-axis. The process for constructing this histogram is therefore - once a backtest is complete, the portfolio value of the rebalance portfolio is compared to that of the HODLed portfolio using the methodology outlined in the section titled “Performance Calculations”. From this comparison, we receive a percent which represents how much better or worse rebalancing performed than HODL. Based on this percent, we increment the count for the number of backtests which fell into the corresponding performance range.
Primary Performance Distribution: -44.4% to 663.9%
Percent of Threshold Backtests that Outperformed HODL: 93.6%
Average Performance Increase: 255%
Median Performance Increase: 216%
5% Threshold Median Portfolio Performance: 216%
10% Threshold

Figure 3: The above histogram compares the percent performance of threshold rebalancing to a buy and hold strategy. The x-axis represents the performance increase over buy and hold for each backtest. The y-axis is the number of backtests which fall into each of the performance ranges on the x-axis. The process for constructing this histogram is therefore - once a backtest is complete, the portfolio value of the rebalance portfolio is compared to that of the HODLed portfolio using the methodology outlined in the section titled “Performance Calculations”. From this comparison, we receive a percent which represents how much better or worse rebalancing performed than HODL. Based on this percent, we increment the count for the number of backtests which fell into the corresponding performance range.
Primary Performance Distribution: -24.4% to 762.7%
Percent of Threshold Backtests that Outperformed HODL: 98.3%
Average Performance Increase: 353%
Median Performance Increase: 298%
10% Threshold Median Portfolio Performance: 298%
15% Threshold

Figure 4: The above histogram compares the percent performance of threshold rebalancing to a buy and hold strategy. The x-axis represents the performance increase over buy and hold for each backtest. The y-axis is the number of backtests which fall into each of the performance ranges on the x-axis. The process for constructing this histogram is therefore - once a backtest is complete, the portfolio value of the rebalance portfolio is compared to that of the HODLed portfolio using the methodology outlined in the section titled “Performance Calculations”. From this comparison, we receive a percent which represents how much better or worse rebalancing performed than HODL. Based on this percent, we increment the count for the number of backtests which fell into the corresponding performance range.
Primary Performance Distribution: -12.9% to 810.1%
Percent of Threshold Backtests that Outperformed HODL: 98.6%
Average Performance Increase: 365%
Median Performance Increase: 305%
15% Threshold Median Portfolio Performance: 305%
20% Threshold

Figure 5: The above histogram compares the percent performance of threshold rebalancing to a buy and hold strategy. The x-axis represents the performance increase over buy and hold for each backtest. The y-axis is the number of backtests which fall into each of the performance ranges on the x-axis. The process for constructing this histogram is therefore - once a backtest is complete, the portfolio value of the rebalance portfolio is compared to that of the HODLed portfolio using the methodology outlined in the section titled “Performance Calculations”. From this comparison, we receive a percent which represents how much better or worse rebalancing performed than HODL. Based on this percent, we increment the count for the number of backtests which fell into the corresponding performance range.
Primary Performance Distribution: -20.3% to 807.8%
Percent of Threshold Backtests that Outperformed HODL: 98.6%
Average Performance Increase: 350%
Median Performance Increase: 295%
20% Threshold Median Portfolio Performance: 295%
25% Threshold

Figure 6: The above histogram compares the percent performance of threshold rebalancing to a buy and hold strategy. The x-axis represents the performance increase over buy and hold for each backtest. The y-axis is the number of backtests which fall into each of the performance ranges on the x-axis. The process for constructing this histogram is therefore - once a backtest is complete, the portfolio value of the rebalance portfolio is compared to that of the HODLed portfolio using the methodology outlined in the section titled “Performance Calculations”. From this comparison, we receive a percent which represents how much better or worse rebalancing performed than HODL. Based on this percent, we increment the count for the number of backtests which fell into the corresponding performance range.
Primary Performance Distribution: -51.8% to 822.0%
Percent of Threshold Backtests that Outperformed HODL: 98.5%
Average Performance Increase: 353%
Median Performance Increase: 289%
25% Threshold Median Portfolio Performance: 289%
30% Threshold

Figure 7: The above histogram compares the percent performance of threshold rebalancing to a buy and hold strategy. The x-axis represents the performance increase over buy and hold for each backtest. The y-axis is the number of backtests which fall into each of the performance ranges on the x-axis. The process for constructing this histogram is therefore - once a backtest is complete, the portfolio value of the rebalance portfolio is compared to that of the HODLed portfolio using the methodology outlined in the section titled “Performance Calculations”. From this comparison, we receive a percent which represents how much better or worse rebalancing performed than HODL. Based on this percent, we increment the count for the number of backtests which fell into the corresponding performance range.
Primary Performance Distribution: -58.2% to 780.5%
Percent of Threshold Backtests that Outperformed HODL: 98.3%
Average Performance Increase: 328%
Median Performance Increase: 279%
30% Threshold Median Portfolio Performance: 279%
35% Threshold

Figure 8: The above histogram compares the percent performance of threshold rebalancing to a buy and hold strategy. The x-axis represents the performance increase over buy and hold for each backtest. The y-axis is the number of backtests which fall into each of the performance ranges on the x-axis. The process for constructing this histogram is therefore - once a backtest is complete, the portfolio value of the rebalance portfolio is compared to that of the HODLed portfolio using the methodology outlined in the section titled “Performance Calculations”. From this comparison, we receive a percent which represents how much better or worse rebalancing performed than HODL. Based on this percent, we increment the count for the number of backtests which fell into the corresponding performance range.
Primary Performance Distribution: -49.5% to 710.5%
Percent of Threshold Backtests that Outperformed HODL: 98.1%
Average Performance Increase: 322%
Median Performance Increase: 275%
35% Threshold Median Portfolio Performance: 275%
40% Threshold

Figure 9: The above histogram compares the percent performance of threshold rebalancing to a buy and hold strategy. The x-axis represents the performance increase over buy and hold for each backtest. The y-axis is the number of backtests which fall into each of the performance ranges on the x-axis. The process for constructing this histogram is therefore - once a backtest is complete, the portfolio value of the rebalance portfolio is compared to that of the HODLed portfolio using the methodology outlined in the section titled “Performance Calculations”. From this comparison, we receive a percent which represents how much better or worse rebalancing performed than HODL. Based on this percent, we increment the count for the number of backtests which fell into the corresponding performance range.
Primary Performance Distribution: -49.7% to 746.6%
Percent of Threshold Backtests that Outperformed HODL: 97.7%
Average Performance Increase: 307%
Median Performance Increase: 268%
40% Threshold Median Portfolio Performance: 268%
45% Threshold

Figure 10: The above histogram compares the percent performance of threshold rebalancing to a buy and hold strategy. The x-axis represents the performance increase over buy and hold for each backtest. The y-axis is the number of backtests which fall into each of the performance ranges on the x-axis. The process for constructing this histogram is therefore - once a backtest is complete, the portfolio value of the rebalance portfolio is compared to that of the HODLed portfolio using the methodology outlined in the section titled “Performance Calculations”. From this comparison, we receive a percent which represents how much better or worse rebalancing performed than HODL. Based on this percent, we increment the count for the number of backtests which fell into the corresponding performance range.
Primary Performance Distribution: -16.5% to 637.0%
Percent of Threshold Backtests that Outperformed HODL: 98.8%
Average Performance Increase: 310%
Median Performance Increase: 274%
45% Threshold Median Portfolio Performance: 274%
50% Threshold

Figure 11: The above histogram compares the percent performance of threshold rebalancing to a buy and hold strategy. The x-axis represents the performance increase over buy and hold for each backtest. The y-axis is the number of backtests which fall into each of the performance ranges on the x-axis. The process for constructing this histogram is therefore - once a backtest is complete, the portfolio value of the rebalance portfolio is compared to that of the HODLed portfolio using the methodology outlined in the section titled “Performance Calculations”. From this comparison, we receive a percent which represents how much better or worse rebalancing performed than HODL. Based on this percent, we increment the count for the number of backtests which fell into the corresponding performance range.
Primary Performance Distribution: -12.3% to 710.8%
Percent of Threshold Backtests that Outperformed HODL: 99.1%
Average Performance Increase: 316%
Median Performance Increase: 275%
50% Threshold Median Portfolio Performance: 275%
Periodic
Results from the periodic rebalancing backtests.
The following periodic rebalancing backtests were run over the same historical data set as the threshold rebalancing backtests. The only difference is the strategy which was employed.
1 hour

Figure 12: The above histogram compares the percent performance of hourly rebalancing to a buy and hold strategy. The x-axis represents the performance increase over buy and hold for each backtest. The y-axis is the number of backtests which fall into each of the performance ranges on the x-axis. The process for constructing this histogram is therefore - once a backtest is complete, the portfolio value of the rebalance portfolio is compared to that of the HODLed portfolio using the methodology outlined in the section titled “Performance Calculations”. From this comparison, we receive a percent which represents how much better or worse rebalancing performed than HODL. Based on this percent, we increment the count for the number of backtests which fell into the corresponding performance range.
Primary Performance Distribution: -93.2% to 336.3%
Percent of Periodic Rebalancing Backtests that Outperformed HODL: 75.3%
Average Performance Increase: 97%
Median Performance Increase: 72%
1 Hour Periodic Rebalance Median Portfolio Performance: 72%
1 day

Figure 13: The above histogram compares the percent performance of daily rebalancing to a buy and hold strategy. The x-axis represents the performance increase over buy and hold for each backtest. The y-axis is the number of backtests which fall into each of the performance ranges on the x-axis. The process for constructing this histogram is therefore - once a backtest is complete, the portfolio value of the rebalance portfolio is compared to that of the HODLed portfolio using the methodology outlined in the section titled “Performance Calculations”. From this comparison, we receive a percent which represents how much better or worse rebalancing performed than HODL. Based on this percent, we increment the count for the number of backtests which fell into the corresponding performance range.
Primary Performance Distribution: -55.2% to 517.7%
Percent of Periodic Rebalancing Backtests that Outperformed HODL: 95.1%
Average Performance Increase: 202%
Median Performance Increase: 166%
1 Day Periodic Rebalance Median Portfolio Performance: 166%
1 week

Figure 14: The above histogram compares the percent performance of weekly rebalancing to a buy and hold strategy. The x-axis represents the performance increase over buy and hold for each backtest. The y-axis is the number of backtests which fall into each of the performance ranges on the x-axis. The process for constructing this histogram is therefore - once a backtest is complete, the portfolio value of the rebalance portfolio is compared to that of the HODLed portfolio using the methodology outlined in the section titled “Performance Calculations”. From this comparison, we receive a percent which represents how much better or worse rebalancing performed than HODL. Based on this percent, we increment the count for the number of backtests which fell into the corresponding performance range.
Primary Performance Distribution: -46.3% to 382.9%
Percent of Periodic Rebalancing Backtests that Outperformed HODL: 94.9%
Average Performance Increase: 152%
Median Performance Increase: 131%
1 Week Periodic Rebalance Median Portfolio Performance: 131%
1 month

Figure 15: The above histogram compares the percent performance of monthly rebalancing to a buy and hold strategy. The x-axis represents the performance increase over buy and hold for each backtest. The y-axis is the number of backtests which fall into each of the performance ranges on the x-axis. The process for constructing this histogram is therefore - once a backtest is complete, the portfolio value of the rebalance portfolio is compared to that of the HODLed portfolio using the methodology outlined in the section titled “Performance Calculations”. From this comparison, we receive a percent which represents how much better or worse rebalancing performed than HODL. Based on this percent, we increment the count for the number of backtests which fell into the corresponding performance range.
Primary Performance Distribution: -63.5% to 368.4%
Percent of Periodic Rebalancing Backtests that Outperformed HODL: 92.3%
Average Performance Increase: 193%
Median Performance Increase: 121%
1 Month Periodic Rebalance Median Portfolio Performance: 121%
Overview
Combining these results, we can generate a few simple charts which will paint a full picture of the median threshold rebalancing performance as we increase the threshold.
The reason we use the median performance across the backtests is because this helps decrease the affect of outliers. As a result, we arrive at a value which tells us 50% of portfolios performed better than the median and 50% performed worse.

Figure 16: The above chart graphs the median performance of threshold rebalancing at each of the corresponding percent thresholds.
The above chart shows how the performance of the median portfolio increases and decreases based on the threshold percent. Starting with a 1% threshold, we observe the lowest median performance of 84%. This quickly climbs as we increase the threshold percent until we reach a 15% threshold. At this point, the median performance peaks at 305%.
Continuing to increase our threshold past 15% does not further improve performance. Instead, we observe a slight decline in performance until it stabilizes around 275%. To summarize these points in another way, we can list the performances for each of the thresholds that were examined. For convenience, we have also included a comparison to the results from the period based rebalance backtests which took place over the same simulated time period.

Figure 17: The above chart lists the median performance of threshold rebalancing at each of the corresponding percent thresholds.
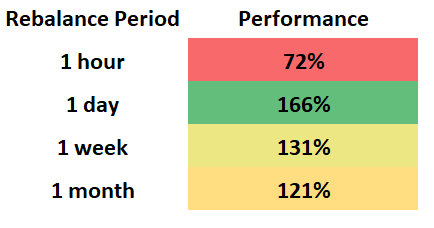
Figure 18: The above chart graphs the median performance of periodic rebalancing at each of the corresponding rebalance period.
The results for the periodic rebalancing strategy indicate the peak performance was obtained with a 1 day rebalancing period for this data set and exchange. In the case of both strategies, the lowest performance was obtained when utilizing a strategy which resulted in high frequency rebalances.
Note: This data is specific to Bittrex. While high frequency rebalancing was found to decrease performance in this study, our past studies which evaluated Binance data suggest executing frequent rebalances on highly liquid and low fee exchanges can result in increased performance. You can find the study here.
There are a number of factors which could cause threshold rebalancing to outperform periodic rebalancing. The most obvious of these reasons is the “need based” trigger that threshold rebalancing employs. Essentially, instead of always rebalancing, regardless of the state of the portfolio, threshold rebalancing will only rebalance when the portfolio has become misaligned due to movements in the market. When the portfolio is aligned with the target allocations, no rebalances will be attempted. This can save on trading fees in the long run.
In addition to saving on fees, threshold rebalancing also empowers portfolios to more accurately capture spikes in the market. When there are moments of large volatility, periodic rebalancing will ignore the changes until the next rebalance period. On the other hand, threshold rebalancing will use this volatility to it’s advantage to rebalance when a spike crosses the threshold.
These two major aspects can allow threshold rebalancing to both reduce costs and increase returns over a long period of time.
Conclusions
The results clearly illustrate threshold rebalancing outperformed both HODLed portfolios as well as those portfolios which utilized a periodic rebalancing strategy. While period based rebalancing peaked at a 166% increase over buy and hold for a 1 day rebalance period, threshold based rebalancing peaked at a 305% performance increase over buy and hold for a 15% threshold.
Other interesting items of note include:
A 15% threshold based rebalance experienced the largest distribution of performance results.
A 50% threshold saw the highest percent of portfolios perform better than HODL at 99.1%.
One hour rebalances saw the lowest percent of portfolios which outperformed HODL at 75.3%.
A 15% threshold rebalance outperformed HODL by 305%.
Threshold Rebalancing with Shrimpy
The results are in and threshold rebalancing has blown away the competition. While it’s possible to implement this strategy on your own, Shrimpy can automate this entire strategy for you in less than 5 minutes. Link an exchange account to any major exchange, select a portfolio, and begin taking advantage of this powerful rebalancing strategy.
If you still can’t decide if Shrimpy is right for you, try the demo.
Additional Reading
Automated Cryptocurrency Index Funds - Personal Asset Management
Portfolio Rebalancing for Cryptocurrency
Cryptocurrency Trading Bots - The Complete Guide
-
 Our research shows that threshold rebalancing outperforms HODL across all popular crypto exchanges and their respec… https://t.co/gykuogddkm
 -
Which exchanges offer the best performance for investors rebalancing their portfolio? Let's just say you're in luc… https://t.co/ycDKXYSV0j
-
You might think that higher trading fees make rebalancing less effective than #HODL 🤔 The truth is that threshold… https://t.co/ppiQc0KS1Z