
A Comparison Of Rebalancing Strategies for Cryptocurrency Portfolios

The cryptocurrency market has some of the fiercest rivalries when it comes to startups. Hundreds of crypto exchanges are fighting tooth and nail for trading volume, liquidity, and new traders. This battle has become one of the focal points in the industry.
In this study, we will be backtesting rebalancing strategies across a variety of different cryptocurrency exchanges and comparing the results. The intention is to create the most reliable guide on how executing trades, and more specifically rebalances, can impact performance from exchange to exchange.
When building your portfolio and setting up your automated strategy, one of the first questions you might ask yourself is “what exchange should I use to trade?” The following results may help us answer that question as well as compare results across exchanges to provide a snapshot of the current market conditions.
Our team has conducted a number of studies in the past, but this will be the first that evaluates the same strategy across a number of different exchanges. That way we can directly compare the same strategy (using the same methodology) being implemented on different exchanges.
The first notable study we released was “Rebalance vs. HODL: A Technical Analysis”. During the intense volatility towards the end of 2017 and into 2018, this study provided exciting results for portfolio rebalancing and once again brought this strategy into the global spotlight.
Shrimpy - Personal Portfolio Management
Shrimpy Developers - Universal Crypto Trading APIs
Introduction
In order to effectively evaluate the difference in performance between rebalancing and a simple buy & hold (“HODL”) strategy, we must first lay the ground rules for how we will execute this study.
Rebalancing
Portfolio rebalancing is the act of trading each individual asset in your portfolio to match a target (desired) set of allocations. At the time of rebalancing, cryptocurrencies will be bought or sold to reach these target allocation percentages.
Let’s look at an example. If you want to have a portfolio with an even split (25%) of 4 different assets, you may want something like 25% BTC, 25% ETH, 25% LTC, and 25% XMR.
Although these might be the desired percentages for each of your assets, that doesn’t mean you currently own that much in each asset. For example, you might have 20% of your portfolio value in BTC, 30% in ETH, 27% in LTC, and 23% in XMR.
During a rebalance, you would sell ETH and LTC in order to buy XMR and BTC. At the end of the rebalance, you will have 25% of each asset in your portfolio.
This simple example would look something like this:
Current Portfolio
Target (Desired) Allocations
Periodic Rebalancing
Periodic rebalancing is the act of rebalancing a portfolio at a regular interval or “period”. At the end of each interval, the portfolio will be rebalanced to once again match the target allocations.
Some examples of common rebalancing periods include 1 hour, 1 day, 1 week, and 1 month rebalance periods. Each of these periods will be evaluated later in this study.
Periodic rebalancing has been a trusted strategy by new cryptocurrency investors due to the simplicity of understanding when and how the portfolio will be maintained.
For example, if a 1 day rebalance period is set for a portfolio, the portfolio will be realigned with the target allocations at the same time every day. This consistency provides a clear expectation for how the strategy will be implemented.
Portfolio Rebalancing for Cryptocurrency
Threshold Rebalancing
Threshold rebalancing uses the same core concepts as periodic rebalancing, but instead of implementing a consistent interval to decide when to rebalance, threshold uses the deviation from the target (desired) allocations to determine when to trigger a rebalance.
The threshold that is evaluated for triggering a threshold-based rebalance is based on the following formula:
Formula: ((C - D) / D) x 100
Where,
C is the current allocation.
D is the desired allocation.
We multiply by 100 to convert from a decimal to a percentage.
If we use the previous example where BTC had a current allocation of 30% and the desired allocation of 25%, we would, therefore, be able to calculate its current deviation by plugging those values into the formula.
BTC Deviation = ((.30 - .25) / .25) x 100
BTC Deviation = 20%
With a current deviation of 20% that means if we had a threshold below 20%, the entire portfolio would be rebalanced.
In this study, we will be evaluating thresholds that range from 1% to 30%. That way we can observe a wide variety of strategies and their performances.
Threshold Rebalancing - The Evolution of Cryptocurrency Portfolio Management
Data & Trade Calculations
The data for this study was collected in real-time from each individual exchange. That means the backtests for Bittrex, for example, use exact market data collected from Bittrex.
We have never used aggregated or estimated data in order to calculate our backtests and this study is no exception. Every trade is calculated using precise order book data from each specific exchange.
During each rebalance event, the historical order book is evaluated, precise trades are simulated based on the actual state of the order book at that time, and the resultant balances are calculated.
Each simulated trade uses the appropriate trading fees that are currently active on the exchange. Since each rebalance will only use taker trades, the spread is crossed in every trade, meaning the spread and trading fees are included in the cost of the rebalance.
In order to provide the most accurate calculations, these backtests will all trade using BTC as the only quote currency. That means if a trade needs to take place between LTC and ETH during the rebalance, the backtest will simulate this as first a trade from LTC to BTC, then a trade from BTC to ETH. There are no optimizations for situations where there are opportunities for direct trading, even if there are direct trading pairs available.
The data for this study begins on January 1, 2019, and ends on January 1, 2020. That way we restrict the evaluation period to only 2019.
Caution: Only exact bid-ask data should be used when running backtests. Using aggregated data from CoinMarketCap or other similar services will result in highly inaccurate calculations. Shrimpy studies have never been compromised by the use of such data.
Backtesting
Each individual strategy was evaluated by running 1,000 backtests on each exchange. That means when we were evaluating a 1-hour rebalancing strategy, for example, we ran 1,000 backtests using that strategy on each exchange.
In total, 66,000 backtests were run to construct the complete results we will be discussing throughout this study.
Portfolio Size
In order to restrict the number of variables, we did not vary the number of assets in the portfolio across backtests. In our past studies, we have found that diversity does impact the performance of the portfolio, so if you’re interested in those results, you can find them here.
Crypto Users Who Diversify Perform Better
This study will use 10 assets for every portfolio.
Allocations
As discussed in previous sections, allocations are the desired percentages for each of the assets in a portfolio. During each rebalance, trades will be made to reach those target allocations.
For simplicity, this study will use even allocations across all assets in each portfolio that is evaluated. That means since there are 10 assets in each portfolio, every asset will hold a percent allocation of 10% in the portfolio.
During each simulated rebalance, the backtest will buy or sell each asset to reach the 10% allocation that was assigned to each asset.
The Best Asset Distribution for Cryptocurrency Rebalancing
Funds
At the start of each backtest, the portfolio is funded with $5,000 as the initial portfolio value. The resulting portfolio values are then calculated based on this starting value.
Asset Selection
In order for the study to remain unbiased towards specific assets, we needed to carefully implement a selection process that incorporated all available assets on an exchange. This was done by first finding the assets that were available throughout the entire backtesting period (January 1, 2019, to January 1, 2020) on each exchange. From the assets that were available, each backtest randomly selected the 10 assets that would participate in the backtest.
The randomization of the asset selection process removes bias for specific assets. Instead of evaluating the performance of specific portfolios, we are attempting to understand the performance of the general strategy.
Performance Calculations
At the end of the backtest, the results are two different values. These values are the final value of the portfolio if a rebalancing strategy had been used and the final value of the portfolio if a HODL strategy had been used.
To determine how these strategies compare, we calculate the performance of the rebalancing strategy against the HODL strategy by using the following formula.
Performance = ((R - H) / H) x 100
where,
R is the final value of the portfolio that used a rebalancing strategy.
H is the final value of the portfolio that used the HODL strategy.
The result is multiplied by 100 to convert from a decimal to a percent.
Notice that all of the results discussed in this study will be comparing a rebalanced portfolio to the exact same HODLed portfolio. That means these values are not relative to the starting value of the portfolio, but the final values resulting from these two strategies.
If a value of 5% is displayed, that means the final result for the rebalanced portfolio is 5% higher than the HODLed portfolio. There will be no discussion on comparing the initial and final values for the portfolio since that is not the purpose of this study.
Selected Exchanges
This study will provide a comprehensive analysis of the rebalance vs HODL performance across 6 major exchanges.
The selected exchanges include:
These exchanges were selected based on their popularity, data availability, and selection of assets.
Note: Exchanges like Coinbase Pro, Gemini, and Bitstamp were excluded from this study due to the limited number of assets that were available on these exchange between January 1, 2019 and January 1, 2020. Since we decided to use a default portfolio size of 10 assets, these exchanges did not provide a diverse enough selection to participate.
Each of the selected exchanges will go through the same backtesting process, that way the results can be directly compared across exchanges.
Results
These results cover both threshold rebalancing and periodic rebalancing. For each exchange, we provide the performance histogram for the best performing strategy in both the threshold rebalancing and periodic rebalancing categories.
Binance Backtests
Binance is the most popular exchange in the world. This can be attributed to the exchange’s high liquidity, low trading fees, and reliable services.
Periodic Rebalancing Results

This histogram shows the performance results of 1,000 backtests. The x-axis is the performance increase over a simple HODL strategy. The y-axis is the number of backtests that fell into the performance buckets that are defined on the x-axis. (Example: A backtest was run and the result was a 15% increase over buy and hold. This would mean you add a 1 in the x-axis bucket that contains 15% in its range. This process is repeated until 1,000 backtests have been run.)
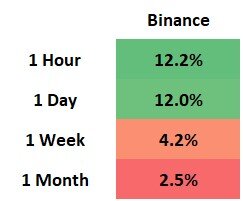
The median performance increase over buy & hold of portfolios that leveraged each of the 4 different rebalance periods.
The Binance periodic rebalancing results demonstrate a historical preference for higher frequency rebalances. As we can see in the colored chart, the best portfolio results were observed when portfolios rebalanced on an hourly or daily interval.
Examining the hourly rebalance histogram, we can see a clear bell curve for the results. These results range from -36% to a 57% increase in performance over buy & hold.
The median hourly rebalancing strategy on Binance outperformed HODL by 12.2%.
Threshold Rebalancing Results

This histogram shows the performance results of 1,000 backtests. The x-axis is the performance increase over a simple HODL strategy. The y-axis is the number of backtests that fell into the performance buckets that are defined on the x-axis. (Example: A backtest was run and the result was a 15% increase over buy and hold. This would mean you add a 1 in the x-axis bucket that contains 15% in its range. This process is repeated until 1,000 backtests have been run.)

The median performance increase over buy & hold of portfolios that leveraged each of the 7 different rebalance thresholds.
Similar to the periodic rebalancing results in some ways, we can see the threshold rebalancing results still demonstrated an affinity towards thresholds that produce higher frequency rebalancing. The highest performing threshold for Binance was a 5% threshold rebalance.
When comparing the results between the periodic and threshold rebalancing strategies, it becomes clear that threshold rebalancing drastically outperformed periodic rebalancing. In fact, out of all the strategies that were tested, there were no periodic rebalancing intervals that outperformed any threshold rebalancing strategies on Binance.
The median 5% threshold rebalancing strategy on Binance outperformed HODL by 21.7%.
Bittrex Backtests
Bittrex is one of the hottest exchanges in the US. With a history of strong security, great customer support, and an ambitious team, it was important for us to examine this industry favorite.
Periodic Rebalancing Results

This histogram shows the performance results of 1,000 backtests. The x-axis is the performance increase over a simple HODL strategy. The y-axis is the number of backtests that fell into the performance buckets that are defined on the x-axis. (Example: A backtest was run and the result was a 15% increase over buy and hold. This would mean you add a 1 in the x-axis bucket that contains 15% in its range. This process is repeated until 1,000 backtests have been run.)

The median performance increase over buy & hold of portfolios that leveraged each of the 4 different rebalance periods.
Unlike Binance, Bittrex has demonstrated an affinity towards slightly longer rebalance periods. This can likely be attributed to their higher trading fees and less liquid order books. The result is more fees will be taken out of the portfolio during each rebalance.
The best rebalancing period for Bittrex throughout 2019 was a 1 week rebalancing period. A 1-day rebalance period came in a close second.
Interestingly, although the median performance for Bittrex was lower than Binance across each periodic rebalancing strategy, the histogram portrays a number of high performing portfolios that outperformed the best portfolios in the Binance study. This shows that although the median portfolio performed worse on Bittrex, the top portfolios performed better.
The median weekly rebalancing strategy on Bittrex outperformed HODL by 7.1%.
Threshold Rebalancing Results

This histogram shows the performance results of 1,000 backtests. The x-axis is the performance increase over a simple HODL strategy. The y-axis is the number of backtests that fell into the performance buckets that are defined on the x-axis. (Example: A backtest was run and the result was a 15% increase over buy and hold. This would mean you add a 1 in the x-axis bucket that contains 15% in its range. This process is repeated until 1,000 backtests have been run.)

The median performance increase over buy & hold of portfolios that leveraged each of the 7 different rebalance thresholds.
Similar to the results of periodic rebalancing, Bittrex experienced higher median performance increases at higher thresholds than Binance. Since higher thresholds result in the portfolio being rebalanced less frequently, this reduces the amount paid in fees.
The results indicate a 20% threshold rebalancing strategy performed the best for Bittrex. The performance closely matched the results observed by the 5% threshold on Binance, however similar to the periodic rebalancing example, the highest performing portfolios once again outperformed portfolios on Binance.
The median 20% threshold rebalancing strategy on Bittrex outperformed HODL by 21.4%.
Kraken Backtests
Kraken has long been competing with Coinbase Pro for the top spot among US exchanges. This institution-friendly exchange could not be overlooked for this study.
Periodic Rebalancing Results

This histogram shows the performance results of 1,000 backtests. The x-axis is the performance increase over a simple HODL strategy. The y-axis is the number of backtests that fell into the performance buckets that are defined on the x-axis. (Example: A backtest was run and the result was a 15% increase over buy and hold. This would mean you add a 1 in the x-axis bucket that contains 15% in its range. This process is repeated until 1,000 backtests have been run.)

The median performance increase over buy & hold of portfolios that leveraged each of the 4 different rebalance periods.
The Kraken periodic rebalancing results demonstrate a historical preference for longer rebalancing periods. In this study, we observed the highest performing interval to be a 1-month rebalance period.
From the histogram, we can see the performance spread is extremely tight. The results only range from -7% to 19% for monthly rebalances. In addition to a smaller spread in the histogram, we also see a smaller spread in the median results for the different periodic strategies.
The median monthly rebalancing strategy on Kraken outperformed HODL by 5.3%.
Threshold Rebalancing Results

This histogram shows the performance results of 1,000 backtests. The x-axis is the performance increase over a simple HODL strategy. The y-axis is the number of backtests that fell into the performance buckets that are defined on the x-axis. (Example: A backtest was run and the result was a 15% increase over buy and hold. This would mean you add a 1 in the x-axis bucket that contains 15% in its range. This process is repeated until 1,000 backtests have been run.)

The median performance increase over buy & hold of portfolios that leveraged each of the 7 different rebalance thresholds.
Similar to the results from the periodic rebalancing backtests, threshold rebalancing also demonstrated an affinity towards higher thresholds. That means less frequent threshold rebalances also performed better than more frequent rebalances.
We can notice that the highest performing threshold performed nearly identically to the highest performing periodic rebalances. However, on average, threshold rebalancing performed better than periodic rebalancing across all the examined thresholds.
The median 30% threshold rebalancing strategy on Kraken outperformed HODL by 5.3%.
KuCoin Backtests
The KuCoin exchange has long been one of the community favorites. Their stellar grassroots marketing has inspired a dedicated following of traders who have fallen in love with the exchange.
Periodic Rebalancing Results

This histogram shows the performance results of 1,000 backtests. The x-axis is the performance increase over a simple HODL strategy. The y-axis is the number of backtests that fell into the performance buckets that are defined on the x-axis. (Example: A backtest was run and the result was a 15% increase over buy and hold. This would mean you add a 1 in the x-axis bucket that contains 15% in its range. This process is repeated until 1,000 backtests have been run.)

The median performance increase over buy & hold of portfolios that leveraged each of the 4 different rebalance periods.
Similar to Kraken, KuCoin portfolios experienced the most benefit from longer rebalancing periods. Here we see the 1-month rebalance period outperformed all other periods.
In contrast to Kraken where we saw tight spreads in performance across the backtests that used the 1-month rebalance period, we see a vast spread for KuCoin. This spread ranges from -84% to 156%.
The highest performing period for KuCoin was a monthly rebalancing interval. This produced the highest results of 12.3% over buy & hold.
Note: The reason we likely see the results generate a bell curve and then some results aggregate at the low-end extreme is due to a few specific assets on KuCoin that have extremely large spreads, low liquidity, or consistently decrease in value. In general, these extremes can be avoided by not adding scams, low liquidity assets, or other low market cap assets to your portfolio.
The median monthly rebalancing strategy on KuCoin outperformed HODL by 12.3%.
Threshold Rebalancing Results

This histogram shows the performance results of 1,000 backtests. The x-axis is the performance increase over a simple HODL strategy. The y-axis is the number of backtests that fell into the performance buckets that are defined on the x-axis. (Example: A backtest was run and the result was a 15% increase over buy and hold. This would mean you add a 1 in the x-axis bucket that contains 15% in its range. This process is repeated until 1,000 backtests have been run.)
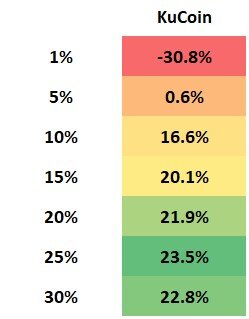
The median performance increase over buy & hold of portfolios that leveraged each of the 7 different rebalance thresholds.
KuCoin saw the highest median performance increase for threshold rebalancing strategies across higher thresholds. The biggest performance increase for threshold rebalancing was seen for the 25% threshold rebalances.
Similar to many of the other exchanges, we saw the highest median performance increases when utilizing threshold rebalancing strategies. In fact, 5 out of the 7 different thresholds outperformed even the top-performing periodic rebalancing strategy on KuCoin.
The median 25% threshold rebalancing strategy on KuCoin outperformed HODL by 23.5%.
OKEx Backtests
OKEx has been a dominant force internationally. Although the exchange may not have had the same influence in the US market as some of the others in this list, it still provides a compelling case to be considered one of the most popular exchanges.
Periodic Rebalancing Results

This histogram shows the performance results of 1,000 backtests. The x-axis is the performance increase over a simple HODL strategy. The y-axis is the number of backtests that fell into the performance buckets that are defined on the x-axis. (Example: A backtest was run and the result was a 15% increase over buy and hold. This would mean you add a 1 in the x-axis bucket that contains 15% in its range. This process is repeated until 1,000 backtests have been run.)

The median performance increase over buy & hold of portfolios that leveraged each of the 4 different rebalance periods.
After examining each of the periodic rebalancing intervals on OKEx, we find that the optimal period was in the middle of our test range. The highest performance is observed for a 1-week rebalance period.
The histogram distribution for the 1-week rebalancing results shows a heavy skew towards the lower end of the spread. The range for these results stretches from a -26% to a 120% performance increase over HODLing.
The median weekly rebalancing strategy on OKEx outperformed HODL by 12.0%.
Threshold Rebalancing Results

This histogram shows the performance results of 1,000 backtests. The x-axis is the performance increase over a simple HODL strategy. The y-axis is the number of backtests that fell into the performance buckets that are defined on the x-axis. (Example: A backtest was run and the result was a 15% increase over buy and hold. This would mean you add a 1 in the x-axis bucket that contains 15% in its range. This process is repeated until 1,000 backtests have been run.)

The median performance increase over buy & hold of portfolios that leveraged each of the 7 different rebalance thresholds.
Threshold rebalancing on OKEx paints an interesting picture. Although the results are similar to the periodic rebalancing results, we find the optimal threshold is on the higher end of the spectrum. The highest median performance increase for threshold rebalancing on OKEx was at a 30% rebalance threshold.
Based on these results, it would be difficult to decisively determine whether threshold or periodic rebalancing historically has performed the best on OKEx. However, it does remain clear that high-frequency rebalancing generally performed worse than lower frequency rebalancing on OKEx.
The median 30% threshold rebalancing strategy on OKEx outperformed HODL by 13.9%.
Poloniex Backtests
Poloniex has an interesting history in the crypto space. After an epic rise and fall, the exchange is now being passed around like a hot potato. Poloniex will be the last exchange we examine in this study.
Periodic Rebalancing Results

This histogram shows the performance results of 1,000 backtests. The x-axis is the performance increase over a simple HODL strategy. The y-axis is the number of backtests that fell into the performance buckets that are defined on the x-axis. (Example: A backtest was run and the result was a 15% increase over buy and hold. This would mean you add a 1 in the x-axis bucket that contains 15% in its range. This process is repeated until 1,000 backtests have been run.)

The median performance increase over buy & hold of portfolios that leveraged each of the 4 different rebalance periods.
Poloniex did not perform very well when it came to periodic rebalancing. Out of the 4 different periodic rebalancing strategies, we found only monthly rebalancing outperformed a HODL strategy. However, the median performance increase was so slim it would be hard to make a conclusive statement on the matter.
The histogram for the Poloniex performance was a sight to behold. It’s nearly a perfect bell curve across the range from -21% to 22%.
The median monthly rebalancing strategy on Poloniex outperformed HODL by 0.3%.
Threshold Rebalancing Results

This histogram shows the performance results of 1,000 backtests. The x-axis is the performance increase over a simple HODL strategy. The y-axis is the number of backtests that fell into the performance buckets that are defined on the x-axis. (Example: A backtest was run and the result was a 15% increase over buy and hold. This would mean you add a 1 in the x-axis bucket that contains 15% in its range. This process is repeated until 1,000 backtests have been run.)

The median performance increase over buy & hold of portfolios that leveraged each of the 7 different rebalance thresholds.
The results for threshold rebalancing appear more promising than periodic rebalancing for Poloniex. As we can see here, only the 1% threshold rebalancing strategy performed worse than HODL. The remaining strategies outperformed HODL. The highest performing threshold rebalancing strategy being a 25% threshold.
The histogram for the 25% threshold results is shown above. We can see a fairly tight range from -17% to 31%. In this range, the majority of the backtests landed between 0% and 10% performance increase over a buy & hold strategy.
The median 25% threshold rebalancing strategy on Poloniex outperformed HODL by 4.6%.
Conclusions
These results show exciting insights into the historical performance of both periodic and threshold rebalancing across 6 major exchanges.
Periodic Rebalancing
Now that we have covered each of the exchanges, we can display the results in a simple grid. That way we can directly compare each of the exchanges we examined. The values displayed in the chart are the median performance increases over buying and holding. That means if there is a value of 10%, the median portfolio performed 10% better by using the rebalancing strategy than buy and hold.

The median performance demonstrates that the higher the rebalance period with the higher number of assets presents the highest gains for rebalancing. Each value represents a percent increase OVER buy and hold. That means a value of 18 means the median of that group performed 18 percent BETTER than buy and hold. This demonstrates, even the absolute worst case performs better than by and hold, even after considering taxes.
Across all the exchanges we’ve examined in this study, we see a clear trend that continues to support the narrative that has been discussed in the past. Essentially, as the liquidity on an exchange increases and the trading fees decrease, we tend to find higher median performance increases at higher rebalancing frequencies. For example, Binance has both high liquidity and a low trading fee, so we would expect to see the highest performance increase on Binance at higher rebalancing frequencies.
Taking all of these results into consideration, we see that the best performing period largely depends on the exchange. It is difficult to pinpoint a single rebalance period that performed the most optimal across all exchanges.
Threshold Rebalancing
Threshold rebalancing provides a similar story. The more liquidity supported on an exchange and lower the trading fees, the higher frequent rebalancing strategies performed optimally.
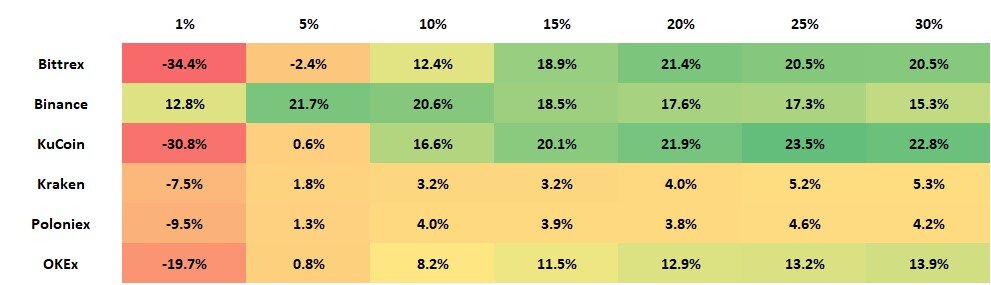
In general, the best performing threshold across most exchanges was somewhere between 15% and 25%. These results agree closely with our previous study on threshold rebalancing.
The Best Threshold for Cryptocurrency Rebalancing Strategies
When we compare these results to those of the periodic rebalancing strategies, we can see a clear indication that threshold rebalancing generally tends to outperform periodic rebalancing strategies.
Although there are a few exceptions, most threshold rebalancing strategies outperformed buy & hold. This is an important indicator for people who are struggling to decide on a single threshold rebalancing strategy.
Limitations
The results from the study only cover data between January 1, 2019, to January 1, 2020. A larger data set would be required to backtest further into the past. Since the cryptocurrency market is volatile, it would be expected that different time periods can produce different performance results.
Historical performance does not determine future results. Although our team has been running extensive backtests for data covering the last 3 years, we cannot guarantee future years will produce the same results.
Additional Reading
Common Rebalance Scenarios in Crypto
This Bitcoin Trading Strategy Outperformed HODLing
Our Trading Bot
Shrimpy is an account aggregating platform for cryptocurrency. It is designed for both professional and novice traders to come and learn about the growing crypto industry. Trade with ease, track your performance, and analyze the market. Shrimpy is the trusted platform for trading over $13B in digital assets.
Follow us on Twitter for updates!